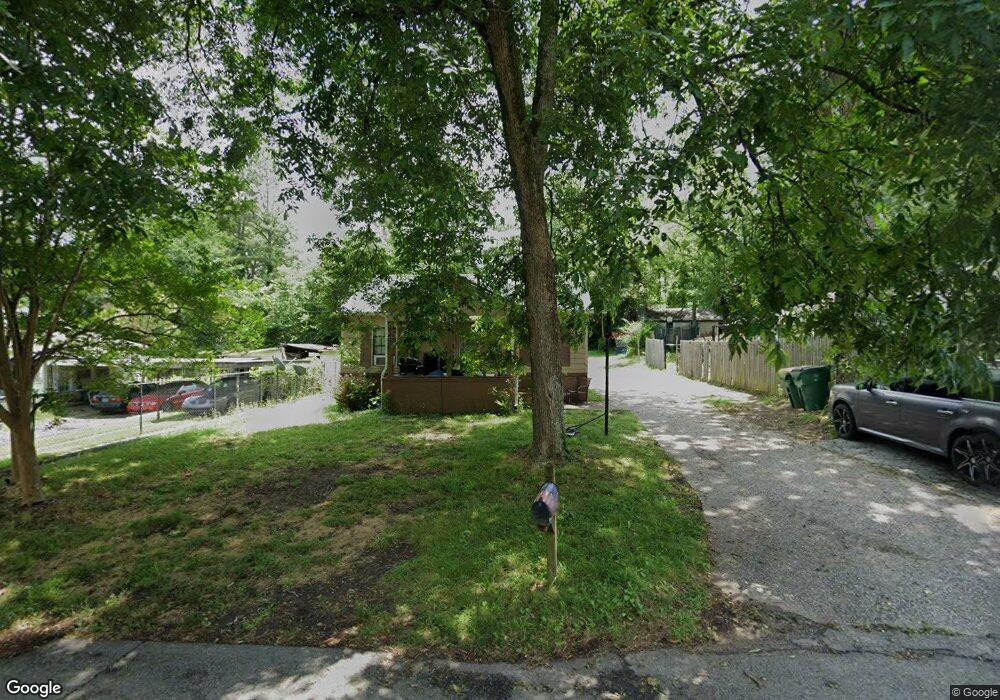
190 James St Winder, GA 30680
Estimated Value: $194,000 - $240,000
3
Beds
2
Baths
1,160
Sq Ft
$187/Sq Ft
Est. Value
About This Home
This home is located at 190 James St, Winder, GA 30680 and is currently estimated at $217,458, approximately $187 per square foot. 190 James St is a home located in Barrow County with nearby schools including County Line Elementary School, Russell Middle School, and Winder-Barrow High School.
Ownership History
Date
Name
Owned For
Owner Type
Purchase Details
Closed on
Jan 30, 2015
Sold by
Mosbey Harrison T
Bought by
Sauls J Charles
Current Estimated Value
Purchase Details
Closed on
Nov 30, 2006
Sold by
Mel-Britt Real Est Inv Inc
Bought by
Mosbey Harrison T
Home Financials for this Owner
Home Financials are based on the most recent Mortgage that was taken out on this home.
Original Mortgage
$77,470
Interest Rate
6.33%
Mortgage Type
New Conventional
Purchase Details
Closed on
Aug 9, 2004
Sold by
Chesnutt Smauel L
Bought by
Edrington Jeff D
Home Financials for this Owner
Home Financials are based on the most recent Mortgage that was taken out on this home.
Original Mortgage
$69,056
Interest Rate
6.19%
Mortgage Type
New Conventional
Purchase Details
Closed on
Oct 12, 1984
Bought by
Thompson Jon H
Create a Home Valuation Report for This Property
The Home Valuation Report is an in-depth analysis detailing your home's value as well as a comparison with similar homes in the area
Home Values in the Area
Average Home Value in this Area
Purchase History
| Date | Buyer | Sale Price | Title Company |
|---|---|---|---|
| Sauls J Charles | $60,000 | -- | |
| Mosbey Harrison T | $76,500 | -- | |
| Edrington Jeff D | $75,000 | -- | |
| Thompson Jon H | $28,000 | -- |
Source: Public Records
Mortgage History
| Date | Status | Borrower | Loan Amount |
|---|---|---|---|
| Previous Owner | Mosbey Harrison T | $77,470 | |
| Previous Owner | Edrington Jeff D | $69,056 |
Source: Public Records
Tax History
| Year | Tax Paid | Tax Assessment Tax Assessment Total Assessment is a certain percentage of the fair market value that is determined by local assessors to be the total taxable value of land and additions on the property. | Land | Improvement |
|---|---|---|---|---|
| 2025 | $1,393 | $49,062 | $12,000 | $37,062 |
| 2024 | $1,386 | $47,971 | $12,000 | $35,971 |
| 2023 | $1,382 | $47,971 | $12,000 | $35,971 |
| 2022 | $1,182 | $32,572 | $12,000 | $20,572 |
| 2021 | $1,250 | $32,572 | $12,000 | $20,572 |
| 2020 | $1,205 | $32,572 | $12,000 | $20,572 |
| 2019 | $1,123 | $29,630 | $10,000 | $19,630 |
| 2018 | $1,121 | $29,630 | $10,000 | $19,630 |
| 2017 | $752 | $25,216 | $8,000 | $17,216 |
| 2016 | $843 | $25,216 | $8,000 | $17,216 |
| 2015 | $884 | $25,216 | $8,000 | $17,216 |
| 2014 | $805 | $22,704 | $5,488 | $17,216 |
| 2013 | -- | $21,882 | $5,488 | $16,394 |
Source: Public Records
Map
Nearby Homes
- 187 Bellview St
- 217 Bellview St
- 206 E 5th Ave
- 253 3rd Ave
- 175 Melrose St
- 236 6th Ave
- 88 W New St
- 127 N Center St
- 59 W Wright St
- 284 E 5th Ave
- 352 3rd Ave
- 0 Jerome St Unit 10359679
- 0 Georgia Highway 211 Unit 7483562
- 1 W Kimball St
- 3 W Kimball St
- 5 W Kimball St
- 0 W Athens St Unit 10544465
- 171 Brookview Terrace
- 136 Alexander Ct
- 17 W Wright St
Your Personal Tour Guide
Ask me questions while you tour the home.