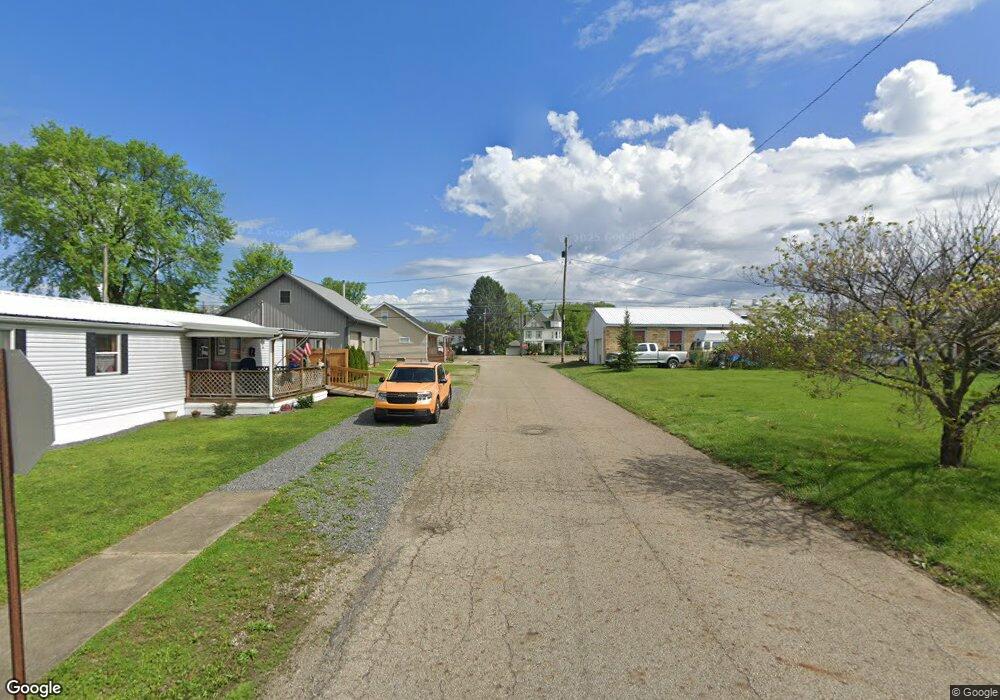
190 Maple St West Lafayette, OH 43845
Estimated Value: $114,000 - $212,000
2
Beds
1
Bath
976
Sq Ft
$159/Sq Ft
Est. Value
About This Home
This home is located at 190 Maple St, West Lafayette, OH 43845 and is currently estimated at $154,935, approximately $158 per square foot. 190 Maple St is a home located in Preble County with nearby schools including Preble Shawnee Elementary School, West Elkton Intermediate School, and Preble Shawnee Junior/Senior High School.
Ownership History
Date
Name
Owned For
Owner Type
Purchase Details
Closed on
Jul 12, 2023
Sold by
Nolan Emme Bel
Bought by
Hayes Haley
Current Estimated Value
Home Financials for this Owner
Home Financials are based on the most recent Mortgage that was taken out on this home.
Original Mortgage
$6,400
Outstanding Balance
$6,244
Interest Rate
6.9%
Estimated Equity
$148,691
Purchase Details
Closed on
Mar 26, 2021
Sold by
Osterberger Patrick D and Osterberger Lori E
Bought by
Nolan Emme Bel
Home Financials for this Owner
Home Financials are based on the most recent Mortgage that was taken out on this home.
Original Mortgage
$95,543
Interest Rate
2.9%
Mortgage Type
FHA
Purchase Details
Closed on
Apr 6, 1994
Bought by
Osterberger Patrick D and Osterberger Lori E
Purchase Details
Closed on
Aug 13, 1992
Bought by
Osterberger Patrick D and Osterberger Lori E
Create a Home Valuation Report for This Property
The Home Valuation Report is an in-depth analysis detailing your home's value as well as a comparison with similar homes in the area
Home Values in the Area
Average Home Value in this Area
Purchase History
| Date | Buyer | Sale Price | Title Company |
|---|---|---|---|
| Hayes Haley | -- | Sterling Land Title | |
| Hayes Haley | -- | Sterling Land Title | |
| Nolan Emme Bel | $99,900 | Prodigy Title Agency | |
| Osterberger Patrick D | $40,000 | -- | |
| Osterberger Patrick D | $16,500 | -- |
Source: Public Records
Mortgage History
| Date | Status | Borrower | Loan Amount |
|---|---|---|---|
| Open | Hayes Haley | $6,400 | |
| Closed | Hayes Haley | $6,400 | |
| Open | Hayes Haley | $125,681 | |
| Closed | Hayes Haley | $125,681 | |
| Previous Owner | Nolan Emme Bel | $95,543 |
Source: Public Records
Tax History Compared to Growth
Tax History
| Year | Tax Paid | Tax Assessment Tax Assessment Total Assessment is a certain percentage of the fair market value that is determined by local assessors to be the total taxable value of land and additions on the property. | Land | Improvement |
|---|---|---|---|---|
| 2024 | $1,068 | $32,070 | $2,210 | $29,860 |
| 2023 | $1,068 | $32,070 | $2,210 | $29,860 |
| 2022 | $893 | $17,150 | $1,540 | $15,610 |
| 2021 | $673 | $17,150 | $1,540 | $15,610 |
| 2020 | $645 | $17,150 | $1,540 | $15,610 |
| 2019 | $542 | $13,760 | $1,330 | $12,430 |
| 2018 | $561 | $13,760 | $1,330 | $12,430 |
| 2017 | $561 | $13,760 | $1,330 | $12,430 |
| 2016 | $543 | $14,530 | $1,330 | $13,200 |
| 2014 | $585 | $14,530 | $1,330 | $13,200 |
| 2013 | $585 | $14,525 | $1,330 | $13,195 |
Source: Public Records
Map
Nearby Homes
- 3412 Ohio 122
- 6171 Somers Gratis Rd
- 8793 Greenbush Rd
- 11756 Ohio 122
- 10149 Pleasant Valley Rd
- 8023 Pleasant Valley Rd
- 6262 Jacksonburg Rd
- 6256 Paullin Dr
- 4583 Oxford Middletown Rd
- 725 Sr
- 132 N Main St
- 9987 Puddenbag Rd
- 1004 Oxford Middletown Rd
- 105 Mill St
- 3550 Oxford-Middletown
- 471 Camden West Elkton Rd
- 4534 Tolbert Rd
- 679 Oxford Germantown Rd
- 2400 Middletown Eaton Rd
- 5438 Middletown Oxford Rd
- 190 W Maple Ave
- 178 W Maple St
- 178 W Maple Ave
- 162 Willow St
- 196 W Maple St
- 124 W Cherry St
- 166 W Maple St
- 162 W Maple Ave
- 171-B W Maple St
- 122 Cherry St
- 174 Camden Ave
- 154 W Maple St
- 157 Willow St
- 146 W Maple St
- 166 Camden Ave
- 160 Camden Ave
- 138 W Maple St
- 189 Camden Ave
- 124 Sycamore St
- 150 Camden Ave