Estimated Value: $321,000 - $384,000
Studio
--
Bath
1,200
Sq Ft
$284/Sq Ft
Est. Value
About This Home
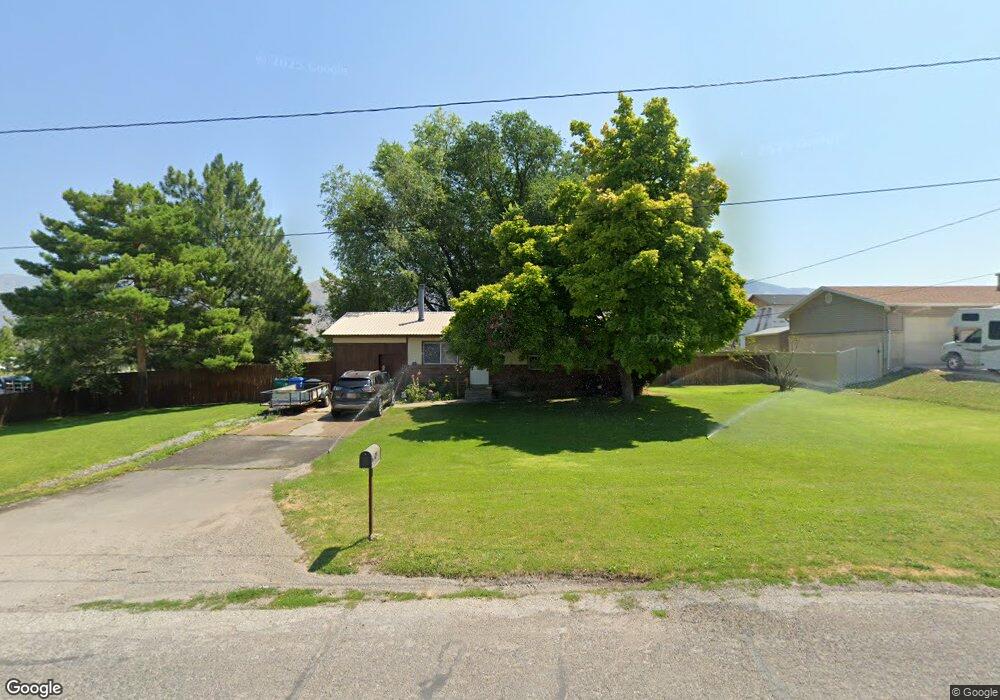
This home is located at 190 N 100 E, Hyrum, UT 84319 and is currently estimated at $340,458, approximately $283 per square foot. 190 N 100 E is a home with nearby schools including Lincoln School, South Cache Middle School, and Mountain Crest High School.
Ownership History
Date
Name
Owned For
Owner Type
Purchase Details
Closed on
Nov 15, 2018
Sold by
Buck Properties Llc
Bought by
Martinez Melissa
Current Estimated Value
Home Financials for this Owner
Home Financials are based on the most recent Mortgage that was taken out on this home.
Original Mortgage
$143,355
Outstanding Balance
$126,694
Interest Rate
5.15%
Mortgage Type
FHA
Estimated Equity
$213,764
Purchase Details
Closed on
Aug 13, 2010
Sold by
Buck Sherm R
Bought by
Buck Properties Llc
Purchase Details
Closed on
Mar 7, 2006
Sold by
Buck Sherm
Bought by
Miller Benjamin M and Miller Alexis Ann
Purchase Details
Closed on
Oct 31, 2005
Sold by
Cache Valley Bank
Bought by
Buck Sherm R
Home Financials for this Owner
Home Financials are based on the most recent Mortgage that was taken out on this home.
Original Mortgage
$75,000
Interest Rate
5.9%
Mortgage Type
Seller Take Back
Create a Home Valuation Report for This Property
The Home Valuation Report is an in-depth analysis detailing your home's value as well as a comparison with similar homes in the area
Home Values in the Area
Average Home Value in this Area
Purchase History
| Date | Buyer | Sale Price | Title Company |
|---|---|---|---|
| Martinez Melissa | -- | Advanced Title Insurance Age | |
| Buck Properties Llc | -- | None Available | |
| Miller Benjamin M | -- | Northern Title Company | |
| Buck Sherm R | -- | Cache Title Company |
Source: Public Records
Mortgage History
| Date | Status | Borrower | Loan Amount |
|---|---|---|---|
| Open | Martinez Melissa | $143,355 | |
| Previous Owner | Buck Sherm R | $75,000 |
Source: Public Records
Tax History Compared to Growth
Tax History
| Year | Tax Paid | Tax Assessment Tax Assessment Total Assessment is a certain percentage of the fair market value that is determined by local assessors to be the total taxable value of land and additions on the property. | Land | Improvement |
|---|---|---|---|---|
| 2025 | $108 | $155,190 | $0 | $0 |
| 2024 | $1,159 | $155,460 | $0 | $0 |
| 2023 | $1,084 | $138,910 | $0 | $0 |
| 2022 | $1,131 | $138,910 | $0 | $0 |
| 2021 | $1,106 | $209,290 | $65,050 | $144,240 |
| 2020 | $1,043 | $185,250 | $65,050 | $120,200 |
| 2019 | $828 | $138,309 | $38,000 | $100,309 |
| 2018 | $762 | $123,008 | $38,000 | $85,008 |
| 2017 | $747 | $62,645 | $0 | $0 |
| 2016 | $764 | $62,645 | $0 | $0 |
| 2015 | $766 | $62,645 | $0 | $0 |
| 2014 | $705 | $58,955 | $0 | $0 |
| 2013 | -- | $58,955 | $0 | $0 |
Source: Public Records
Map
Nearby Homes