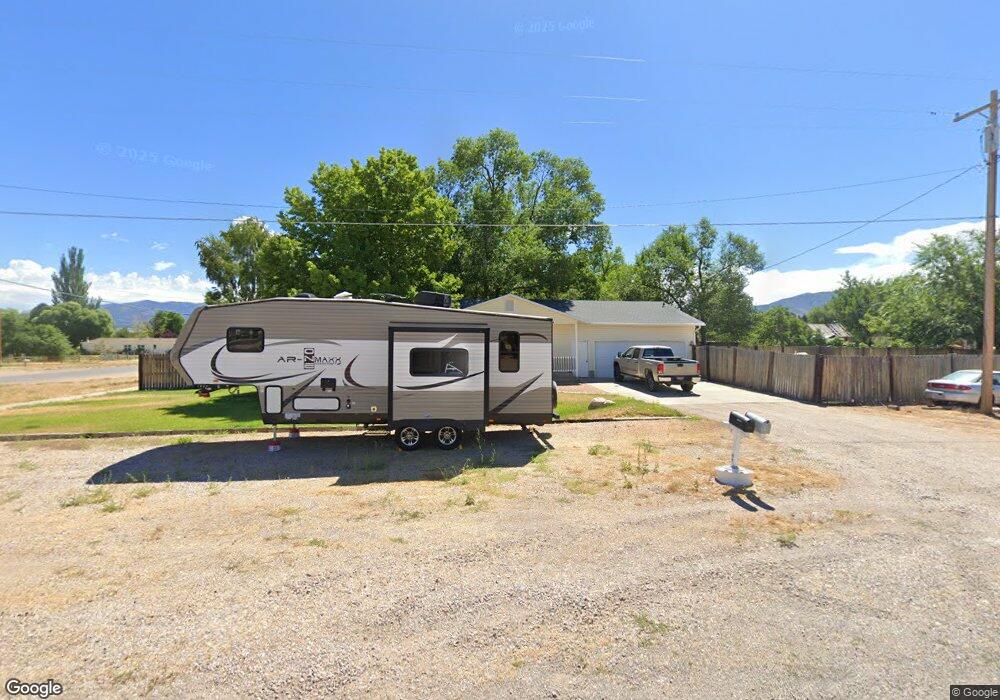
190 N 300 W Fillmore, UT 84631
Estimated Value: $355,000 - $438,000
4
Beds
3
Baths
2,910
Sq Ft
$132/Sq Ft
Est. Value
About This Home
This home is located at 190 N 300 W, Fillmore, UT 84631 and is currently estimated at $384,730, approximately $132 per square foot. 190 N 300 W is a home located in Millard County.
Ownership History
Date
Name
Owned For
Owner Type
Purchase Details
Closed on
May 13, 2010
Sold by
Myers Stoney and Myers Kristine
Bought by
Burraston Baline and Burraston Julie
Current Estimated Value
Home Financials for this Owner
Home Financials are based on the most recent Mortgage that was taken out on this home.
Original Mortgage
$180,667
Outstanding Balance
$123,272
Interest Rate
5.5%
Mortgage Type
FHA
Estimated Equity
$261,458
Create a Home Valuation Report for This Property
The Home Valuation Report is an in-depth analysis detailing your home's value as well as a comparison with similar homes in the area
Home Values in the Area
Average Home Value in this Area
Purchase History
| Date | Buyer | Sale Price | Title Company |
|---|---|---|---|
| Burraston Baline | -- | -- |
Source: Public Records
Mortgage History
| Date | Status | Borrower | Loan Amount |
|---|---|---|---|
| Open | Burraston Baline | $180,667 |
Source: Public Records
Tax History Compared to Growth
Tax History
| Year | Tax Paid | Tax Assessment Tax Assessment Total Assessment is a certain percentage of the fair market value that is determined by local assessors to be the total taxable value of land and additions on the property. | Land | Improvement |
|---|---|---|---|---|
| 2025 | $1,729 | $217,127 | $23,020 | $194,107 |
| 2024 | $1,729 | $193,154 | $20,292 | $172,862 |
| 2023 | $2,075 | $193,154 | $20,292 | $172,862 |
| 2022 | $1,728 | $155,189 | $18,448 | $136,741 |
| 2021 | $1,536 | $132,441 | $11,979 | $120,462 |
| 2020 | $1,425 | $123,538 | $10,890 | $112,648 |
| 2019 | $1,204 | $104,696 | $10,890 | $93,806 |
| 2018 | $1,146 | $102,051 | $10,890 | $91,161 |
| 2017 | $979 | $82,894 | $10,890 | $72,004 |
| 2016 | $937 | $82,894 | $10,890 | $72,004 |
| 2015 | $937 | $82,894 | $10,890 | $72,004 |
| 2014 | -- | $82,894 | $10,890 | $72,004 |
| 2013 | -- | $82,894 | $10,890 | $72,004 |
Source: Public Records
Map
Nearby Homes
- 225 W 200 St N
- 165 N 100 W
- 295 N 100 West St
- 75 N 100 West St
- 335 W 400 North St
- 380 N 200 St W
- 390 N 100 W
- 40 S 100 Rd E
- 410 W 400 N
- 120 S 100 East Rd
- 310 S 500 West Rd
- 190 W 400 St S
- 220 S 200 E
- 155 E 500 St S
- 157 E 500 South St
- 430 E Canyon Rd
- 405 E 500 St S
- 310 S 600 E
- 2155 N Cedar Mountain Rd
- 2835 N Cedar Mountain Rd