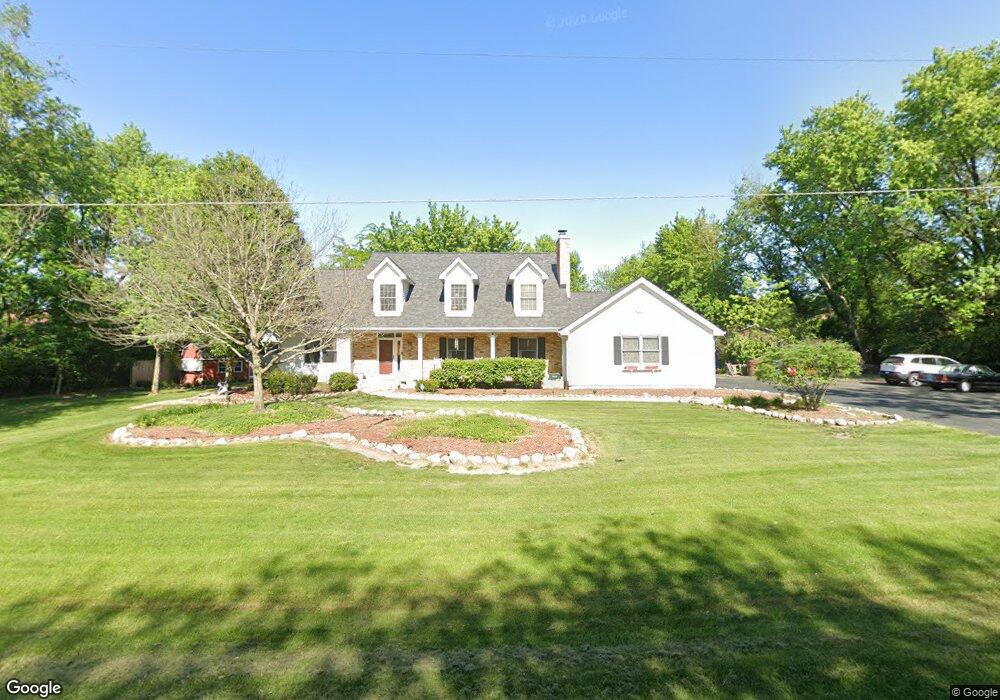
190 N Anderson Rd New Lenox, IL 60451
Estimated Value: $380,000 - $508,883
--
Bed
--
Bath
--
Sq Ft
0.94
Acres
About This Home
This home is located at 190 N Anderson Rd, New Lenox, IL 60451 and is currently estimated at $424,471. 190 N Anderson Rd is a home located in Will County with nearby schools including Bentley Elementary School, Arnold J Tyler School, and Alex M Martino Jr High School.
Ownership History
Date
Name
Owned For
Owner Type
Purchase Details
Closed on
May 28, 2025
Sold by
Dipaolo Nicole M and Danhour Nicole M
Bought by
Trust Number 9002346752 and Chicago Title Land Trust
Current Estimated Value
Purchase Details
Closed on
Jan 27, 2025
Sold by
Dipaolo Nicole M and Danhour Nicole M
Bought by
Dipaolo Nicole M
Purchase Details
Closed on
Jul 13, 2010
Sold by
Danhour Randy R
Bought by
Danhour Nicole M
Purchase Details
Closed on
Aug 22, 2006
Sold by
Burnsides Sanctuary Pointe Llc
Bought by
Cole Taylor Bank
Purchase Details
Closed on
Jul 20, 1994
Sold by
Nlsb
Bought by
Danhour Randy R and Danhour Nicole M
Home Financials for this Owner
Home Financials are based on the most recent Mortgage that was taken out on this home.
Original Mortgage
$79,000
Interest Rate
8.41%
Create a Home Valuation Report for This Property
The Home Valuation Report is an in-depth analysis detailing your home's value as well as a comparison with similar homes in the area
Home Values in the Area
Average Home Value in this Area
Purchase History
| Date | Buyer | Sale Price | Title Company |
|---|---|---|---|
| Trust Number 9002346752 | $400,000 | None Listed On Document | |
| Dipaolo Nicole M | -- | None Listed On Document | |
| Danhour Nicole M | -- | None Available | |
| Cole Taylor Bank | -- | Chicago Title Insurance Co | |
| Danhour Randy R | $194,000 | -- |
Source: Public Records
Mortgage History
| Date | Status | Borrower | Loan Amount |
|---|---|---|---|
| Previous Owner | Danhour Randy R | $79,000 |
Source: Public Records
Tax History Compared to Growth
Tax History
| Year | Tax Paid | Tax Assessment Tax Assessment Total Assessment is a certain percentage of the fair market value that is determined by local assessors to be the total taxable value of land and additions on the property. | Land | Improvement |
|---|---|---|---|---|
| 2024 | $11,704 | $157,588 | $36,367 | $121,221 |
| 2023 | $11,704 | $143,653 | $33,151 | $110,502 |
| 2022 | $10,538 | $132,338 | $30,540 | $101,798 |
| 2021 | $10,011 | $124,460 | $28,722 | $95,738 |
| 2020 | $9,727 | $120,019 | $27,697 | $92,322 |
| 2019 | $9,306 | $116,297 | $26,838 | $89,459 |
| 2018 | $9,091 | $112,289 | $25,913 | $86,376 |
| 2017 | $8,631 | $109,061 | $25,168 | $83,893 |
| 2016 | $8,379 | $106,142 | $24,494 | $81,648 |
| 2015 | $8,116 | $102,801 | $23,723 | $79,078 |
| 2014 | $8,116 | $101,532 | $23,430 | $78,102 |
| 2013 | $8,116 | $102,901 | $23,746 | $79,155 |
Source: Public Records
Map
Nearby Homes
- 125 N Anderson Rd
- 1212 Georgias Way
- 1245 Georgias Way
- 1193 Georgias Way
- 1139 Georgias Way
- 1125 Georgias Way
- 1017 E Lincoln Hwy
- 214 Somerset Ct
- 513 Somerset Ln
- 449 Somerset Ln Unit 1
- 621 Chatfield Rd
- 1351 E Lincoln Hwy
- 1920 Tessington Ct
- 1931 Tessington Ct
- 1108 Plaza Dr
- 821 Chatfield Rd
- 12932 Carrington Ct
- 1535 Glenbrooke Ln
- 641 Lisson Grove
- 701 Bishops Gate
- 200 N Anderson Rd
- 911 Herr Dr
- 140 N Anderson Rd
- 161 N Anderson Rd
- 915 Herr Dr
- 136 N Anderson Rd
- 910 Harmoni Ln
- 919 Herr Dr
- 151 N Anderson Rd
- 181 N Anderson Rd
- 210 N Anderson Rd
- 927 Herr Dr
- 918 Herr Dr
- 920 Harmoni Ln
- 915 Harmoni Ln
- 130 N Anderson Rd
- 201 N Anderson Rd
- 924 Herr Dr
- 220 N Anderson Rd
- 935 Herr Dr