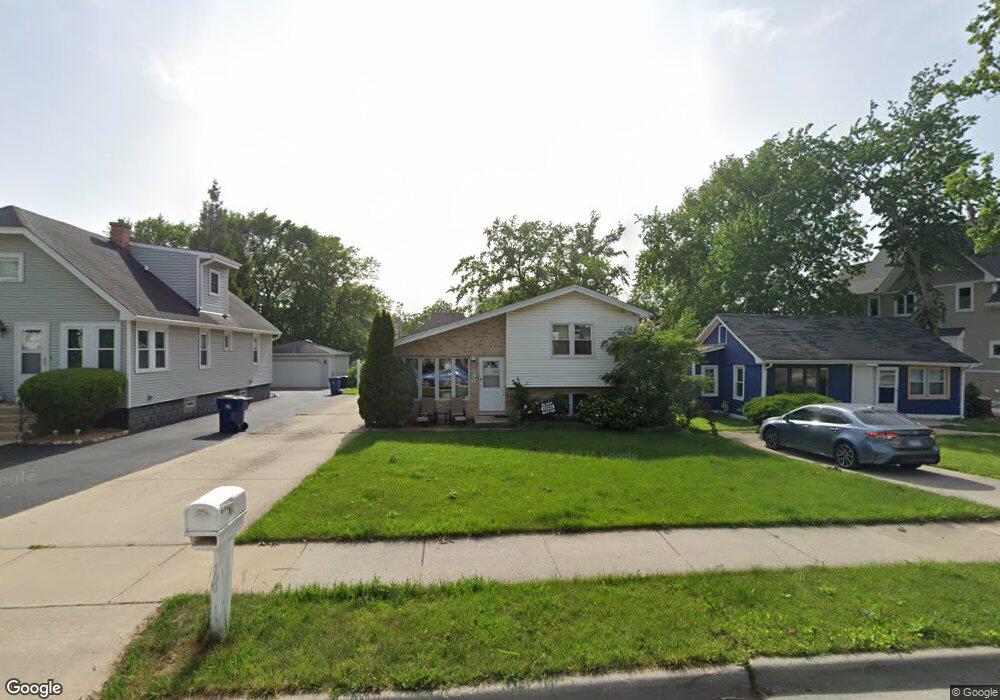
190 N Glenview Ave Elmhurst, IL 60126
Estimated Value: $441,000 - $548,000
Studio
--
Bath
1,156
Sq Ft
$428/Sq Ft
Est. Value
About This Home
This home is located at 190 N Glenview Ave, Elmhurst, IL 60126 and is currently estimated at $494,357, approximately $427 per square foot. 190 N Glenview Ave is a home located in DuPage County with nearby schools including Hawthorne Elementary School, Sandburg Middle School, and Churchville Middle School.
Ownership History
Date
Name
Owned For
Owner Type
Purchase Details
Closed on
Sep 24, 2013
Sold by
Schelberger Kenneth J and Schelberger Janette I
Bought by
Schelberger Kenneth J and Schelberger Janette I
Current Estimated Value
Purchase Details
Closed on
May 19, 1995
Sold by
Mcguire Sean
Bought by
Schelberger Kenneth J and Schelberger Janette I
Home Financials for this Owner
Home Financials are based on the most recent Mortgage that was taken out on this home.
Original Mortgage
$145,000
Interest Rate
8.42%
Purchase Details
Closed on
Sep 12, 1994
Sold by
Mcguire John
Bought by
Mcguire Sean
Create a Home Valuation Report for This Property
The Home Valuation Report is an in-depth analysis detailing your home's value as well as a comparison with similar homes in the area
Home Values in the Area
Average Home Value in this Area
Purchase History
| Date | Buyer | Sale Price | Title Company |
|---|---|---|---|
| Schelberger Kenneth J | -- | None Available | |
| Schelberger Kenneth J | $155,000 | -- | |
| Mcguire Sean | -- | -- |
Source: Public Records
Mortgage History
| Date | Status | Borrower | Loan Amount |
|---|---|---|---|
| Closed | Schelberger Kenneth J | $145,000 |
Source: Public Records
Tax History Compared to Growth
Tax History
| Year | Tax Paid | Tax Assessment Tax Assessment Total Assessment is a certain percentage of the fair market value that is determined by local assessors to be the total taxable value of land and additions on the property. | Land | Improvement |
|---|---|---|---|---|
| 2024 | $7,513 | $134,667 | $38,368 | $96,299 |
| 2023 | $6,953 | $124,530 | $35,480 | $89,050 |
| 2022 | $6,774 | $119,710 | $34,110 | $85,600 |
| 2021 | $6,600 | $116,730 | $33,260 | $83,470 |
| 2020 | $6,339 | $114,170 | $32,530 | $81,640 |
| 2019 | $6,194 | $108,550 | $30,930 | $77,620 |
| 2018 | $6,751 | $114,970 | $29,290 | $85,680 |
| 2017 | $6,598 | $109,560 | $27,910 | $81,650 |
| 2016 | $6,453 | $103,210 | $26,290 | $76,920 |
| 2015 | $6,380 | $96,150 | $24,490 | $71,660 |
| 2014 | $4,884 | $69,380 | $22,360 | $47,020 |
| 2013 | $4,834 | $70,350 | $22,670 | $47,680 |
Source: Public Records
Map
Nearby Homes
- 261 N Highview Ave
- 285 N Ridgeland Ave
- 284 N Highland Ave
- 322 N Highland Ave
- 355 W 1st St
- 196 N Walnut St
- 120 N Walnut St
- 17W517 Manor Ln
- 204 E Hill St
- 367 N Oak St
- 508 W Alma St
- 255 S West Ave Unit 413
- 255 S West Ave Unit 214
- 104 Evergreen Ave
- 468 N Highland Ave
- 594 W Comstock Ave
- 1044 S Ellsworth Ave
- 656 W Comstock Ave
- 452 W Alma St
- 639 W Comstock Ave
- 186 N Glenview Ave
- 196 Glenview Ave
- 198 N Glenview Ave
- 184 N Glenview Ave
- 200 N Glenview Ave
- 182 N Glenview Ave
- 199 N Glade Ave
- 193 N Glade Ave
- 203 N Glade Ave
- 204 N Glenview Ave
- 191 N Glade Ave
- 207 N Glade Ave
- 189 N Glenview Ave
- 209 N Glade Ave
- 193 N Glenview Ave
- 180 N Glenview Ave
- 197 N Glenview Ave
- 549 W 2nd St
- 216 N Glenview Ave
- 201 N Glenview Ave