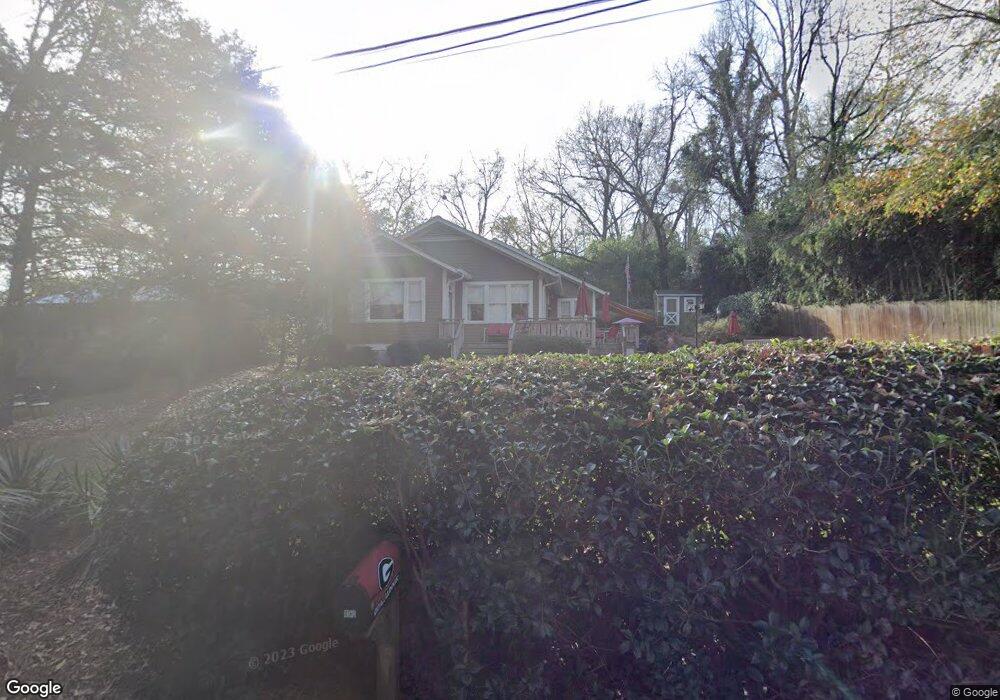
190 Pinecrest Ct Athens, GA 30605
Five Points NeighborhoodEstimated Value: $524,000 - $676,000
Studio
--
Bath
1,436
Sq Ft
$425/Sq Ft
Est. Value
About This Home
This home is located at 190 Pinecrest Ct, Athens, GA 30605 and is currently estimated at $610,032, approximately $424 per square foot. 190 Pinecrest Ct is a home located in Clarke County with nearby schools including Barrow Elementary School, Clarke Middle School, and Clarke Central High School.
Ownership History
Date
Name
Owned For
Owner Type
Purchase Details
Closed on
Sep 1, 2004
Sold by
Addison Loveanne B
Bought by
Addison John A
Current Estimated Value
Purchase Details
Closed on
Aug 31, 2004
Sold by
Beveridge Scott T and Beveridge Michele M
Bought by
Addison John A and Addi Loveanne B
Purchase Details
Closed on
Dec 14, 2001
Sold by
Reynolds Thomas L and Reynolds Vern J
Bought by
Beveridge Scott T and Bever Michele M
Purchase Details
Closed on
Sep 14, 2001
Sold by
Bolton Theodoew Icelene J Bolton and Bolton Angie
Bought by
Reynolds Thomas L and Stric Vern J
Purchase Details
Closed on
Oct 14, 1999
Sold by
Bolton Theodore Icelene J Bolton and Bolton Angie
Bought by
Strickland Vern
Purchase Details
Closed on
Jan 13, 1997
Sold by
Allen Alvin C and Anderson Benjamin S
Bought by
Bolton Theodore Icelene J Bolton
Purchase Details
Closed on
Nov 1, 1996
Sold by
Allen Alvin C and Allen Juanita
Bought by
Allen Alvin C and Anderson Benjamin S
Create a Home Valuation Report for This Property
The Home Valuation Report is an in-depth analysis detailing your home's value as well as a comparison with similar homes in the area
Home Values in the Area
Average Home Value in this Area
Purchase History
| Date | Buyer | Sale Price | Title Company |
|---|---|---|---|
| Addison John A | -- | -- | |
| Addison John A | $245,000 | -- | |
| Beveridge Scott T | -- | -- | |
| Reynolds Thomas L | $35,000 | -- | |
| Strickland Vern | -- | -- | |
| Bolton Theodore Icelene J Bolton | $25,000 | -- | |
| Allen Alvin C | -- | -- |
Source: Public Records
Tax History
| Year | Tax Paid | Tax Assessment Tax Assessment Total Assessment is a certain percentage of the fair market value that is determined by local assessors to be the total taxable value of land and additions on the property. | Land | Improvement |
|---|---|---|---|---|
| 2025 | $6,114 | $196,917 | $48,000 | $148,917 |
| 2024 | $6,114 | $182,273 | $48,000 | $134,273 |
| 2023 | $5,696 | $165,862 | $48,000 | $117,862 |
| 2022 | $4,607 | $144,423 | $35,200 | $109,223 |
| 2021 | $4,050 | $120,171 | $35,200 | $84,971 |
| 2020 | $3,905 | $115,883 | $32,000 | $83,883 |
| 2019 | $3,760 | $110,747 | $32,000 | $78,747 |
| 2018 | $3,693 | $108,771 | $32,000 | $76,771 |
| 2017 | $3,182 | $93,736 | $32,000 | $61,736 |
| 2016 | $3,260 | $96,018 | $32,000 | $64,018 |
| 2015 | $3,156 | $92,818 | $28,800 | $64,018 |
| 2014 | $3,160 | $92,819 | $28,800 | $64,019 |
Source: Public Records
Map
Nearby Homes
- 1697 S Milledge Ave
- 760 E Campus Rd Unit 95
- 655 E Campus Rd Unit 33
- 655 E Campus Rd
- 655 E Campus Rd Unit 12
- 115 Annes Ct
- 145 Riverdale Dr
- 1775 S Milledge Ave Unit 15
- 150 Gran Ellen Dr
- 128 Habersham Dr
- 183 Parkway Dr
- 293 Southview Dr
- 301 Parkway Dr
- 1905 S Milledge Ave Unit 36
- 1905 S Milledge Ave Unit 5
- 230 Milledge Terrace
- 100 Davis St Unit 11
- 390 Milledge Terrace
- 210 Davis Estates Rd
- 170 Northview Dr Unit 5
- 160 Pinecrest Ct
- 490 Pinecrest Ct
- 695 Pinecrest Dr
- 150 Pinecrest Ct
- 494 Pinecrest Ct
- 760 Campus Dr E Unit 69
- 760 Campus Dr E Unit 64
- 760 Campus Dr E Unit 47
- 760 Campus Dr E Unit 70
- 760 Campus Dr E Unit 95
- 760 Campus Dr E Unit 94
- 760 Campus Dr E Unit 56
- 760 Campus Dr E Unit 89
- 780 E Campus Rd
- 100 Riverdale Dr
- 760 E Campus Rd Unit 43
- 760 E Campus Rd Unit 74
- 760 E Campus Rd Unit 94
- 760 E Campus Rd Unit 93
- 760 E Campus Rd Unit 92
Your Personal Tour Guide
Ask me questions while you tour the home.