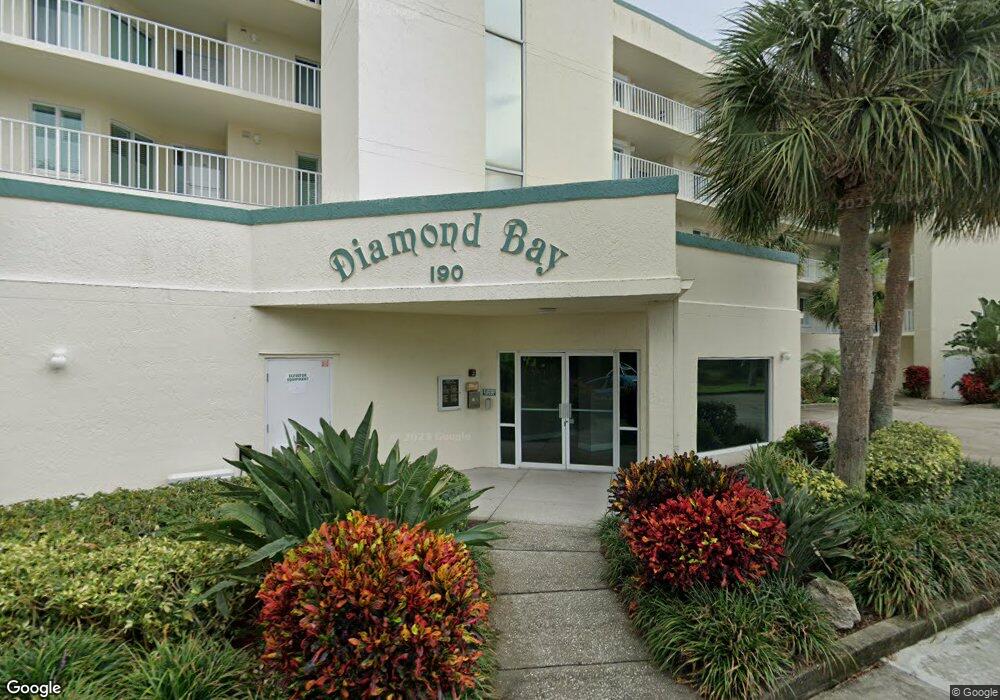
190 Pinellas Ln Unit 509A Cocoa Beach, FL 32931
Estimated Value: $466,000 - $601,000
3
Beds
2
Baths
1,911
Sq Ft
$275/Sq Ft
Est. Value
About This Home
This home is located at 190 Pinellas Ln Unit 509A, Cocoa Beach, FL 32931 and is currently estimated at $525,882, approximately $275 per square foot. 190 Pinellas Ln Unit 509A is a home located in Brevard County with nearby schools including Cape View Elementary School, Cocoa Beach Junior/Senior High School, and Our Saviour School.
Ownership History
Date
Name
Owned For
Owner Type
Purchase Details
Closed on
Jan 26, 2016
Sold by
Peterson Harry J and Peterson Betty L
Bought by
Peterson Harry J and Peterson Brett A
Current Estimated Value
Purchase Details
Closed on
Jan 10, 2014
Sold by
Arendas Gary M and Arendas Edna Ann
Bought by
Peterson Harry J and Peterson Betty L
Purchase Details
Closed on
Feb 23, 2012
Sold by
Arendas Gary M
Bought by
Arendas Gary M and Arendas Edna Ann
Purchase Details
Closed on
Nov 7, 2000
Sold by
Torpey James and Torpey Joann
Bought by
Arendas Stella A
Purchase Details
Closed on
May 19, 1994
Sold by
Diamond Bay Dev Inc
Bought by
Torpey James and Torpey Joann
Home Financials for this Owner
Home Financials are based on the most recent Mortgage that was taken out on this home.
Original Mortgage
$130,700
Interest Rate
8.48%
Create a Home Valuation Report for This Property
The Home Valuation Report is an in-depth analysis detailing your home's value as well as a comparison with similar homes in the area
Home Values in the Area
Average Home Value in this Area
Purchase History
| Date | Buyer | Sale Price | Title Company |
|---|---|---|---|
| Peterson Harry J | -- | Attorney | |
| Peterson Harry J | $275,000 | None Available | |
| Arendas Gary M | $90,000 | A1a Beachside Title Inc | |
| Arendas Stella A | $265,000 | -- | |
| Torpey James | $163,285 | -- |
Source: Public Records
Mortgage History
| Date | Status | Borrower | Loan Amount |
|---|---|---|---|
| Previous Owner | Torpey James | $130,700 |
Source: Public Records
Tax History Compared to Growth
Tax History
| Year | Tax Paid | Tax Assessment Tax Assessment Total Assessment is a certain percentage of the fair market value that is determined by local assessors to be the total taxable value of land and additions on the property. | Land | Improvement |
|---|---|---|---|---|
| 2025 | $4,283 | $311,330 | -- | -- |
| 2024 | $4,197 | $302,560 | -- | -- |
| 2023 | $4,197 | $293,750 | $0 | $0 |
| 2022 | $3,894 | $285,200 | $0 | $0 |
| 2021 | $3,889 | $276,900 | $0 | $0 |
| 2020 | $3,858 | $273,080 | $0 | $0 |
| 2019 | $3,835 | $266,950 | $0 | $0 |
| 2018 | $3,819 | $261,980 | $0 | $0 |
| 2017 | $3,844 | $256,600 | $0 | $0 |
| 2016 | $3,834 | $251,330 | $0 | $0 |
| 2015 | $3,829 | $249,590 | $0 | $0 |
| 2014 | $3,583 | $193,430 | $0 | $0 |
Source: Public Records
Map
Nearby Homes
- 188 Pinellas Ln Unit 201B
- 190 Pinellas Ln Unit 508A
- 190 Escambia Ln Unit 402
- 145 Escambia Ln Unit 103
- 191 Seminole Ln Unit 203
- 3609 S Banana River Blvd Unit 206
- 3609 S Banana River Blvd Unit 407
- 3611 S Banana River Blvd Unit C-203
- 3165 N Atlantic Ave Unit A-107
- 3165 N Atlantic Ave Unit C206
- 3165 N Atlantic Ave Unit A506
- 3165 N Atlantic Ave Unit B 506
- 3165 N Atlantic Ave Unit B105
- 200 Saint Lucie Ln Unit 507
- 3180 N Atlantic Ave Unit B206
- 3160 N Atlantic Ave Unit A106
- 3799 S Banana River Blvd Unit 505
- 3799 S Banana River Blvd Unit 104
- 3799 S Banana River Blvd Unit 512
- 171 Wakulla Ln Unit E
- 188 Pinellas Ln
- 188 Pinellas Ln Unit 309a
- 188 Pinellas Ln Unit 304B
- 188 Pinellas Ln Unit 204B
- 188 Pinellas Ln Unit 202B
- 188 Pinellas Ln Unit 303B
- 188 Pinellas Ln Unit 403B
- 188 Pinellas Ln Unit 504B
- 188 Pinellas Ln Unit 502B
- 188 Pinellas Ln Unit 401B
- 188 Pinellas Ln Unit 301B
- 188 Pinellas Ln Unit 404B
- 188 Pinellas Ln Unit 501B
- 188 Pinellas Ln Unit 402B
- 188 Pinellas Ln Unit 302B
- 188 Pinellas Ln Unit 203B
- 188 Pinellas Ln Unit 503B
- 188 Pinellas Ln Unit B401
- 190 Pinellas Ln
- 190 Pinellas Ln Unit 409A