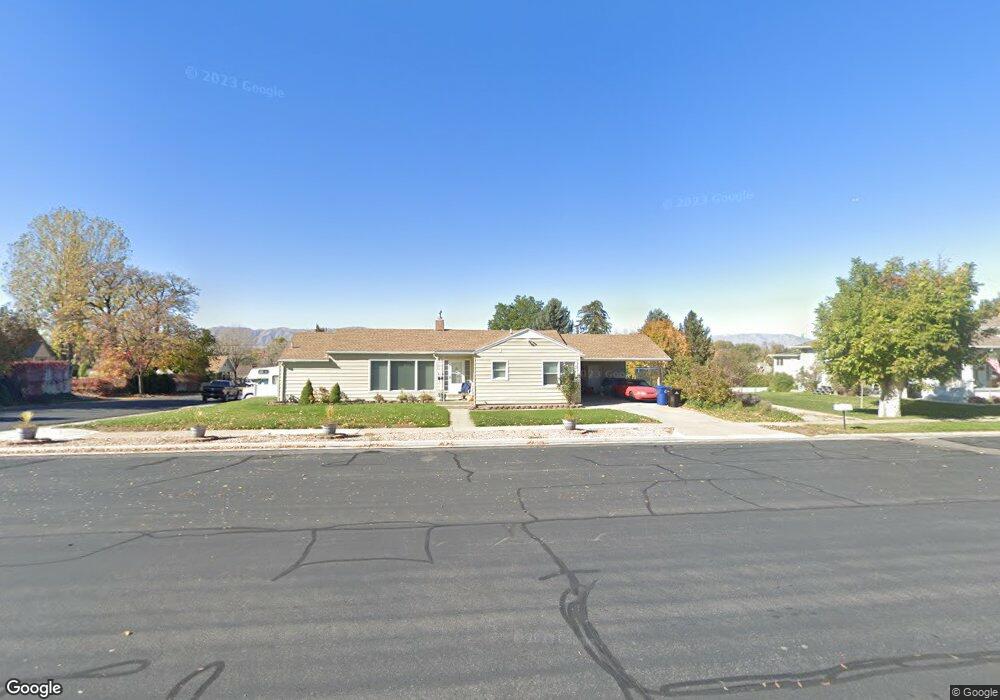
190 S 300 E Spanish Fork, UT 84660
Estimated Value: $376,952 - $406,000
3
Beds
2
Baths
1,228
Sq Ft
$318/Sq Ft
Est. Value
About This Home
This home is located at 190 S 300 E, Spanish Fork, UT 84660 and is currently estimated at $390,984, approximately $318 per square foot. 190 S 300 E is a home located in Utah County with nearby schools including Park Elementary School, Spanish Fork Jr High School, and Spanish Fork High School.
Ownership History
Date
Name
Owned For
Owner Type
Purchase Details
Closed on
Apr 25, 2007
Sold by
Levanger John O and Elva C Levanger Living Trust
Bought by
Levanger Cheryl Ann
Current Estimated Value
Home Financials for this Owner
Home Financials are based on the most recent Mortgage that was taken out on this home.
Original Mortgage
$145,713
Outstanding Balance
$87,908
Interest Rate
6.11%
Mortgage Type
FHA
Estimated Equity
$303,076
Purchase Details
Closed on
Nov 19, 1996
Sold by
Levanger Elva
Bought by
Levanger Elva C
Create a Home Valuation Report for This Property
The Home Valuation Report is an in-depth analysis detailing your home's value as well as a comparison with similar homes in the area
Home Values in the Area
Average Home Value in this Area
Purchase History
| Date | Buyer | Sale Price | Title Company |
|---|---|---|---|
| Levanger Cheryl Ann | -- | First American Title Agency | |
| Levanger Elva C | -- | -- |
Source: Public Records
Mortgage History
| Date | Status | Borrower | Loan Amount |
|---|---|---|---|
| Open | Levanger Cheryl Ann | $145,713 |
Source: Public Records
Tax History
| Year | Tax Paid | Tax Assessment Tax Assessment Total Assessment is a certain percentage of the fair market value that is determined by local assessors to be the total taxable value of land and additions on the property. | Land | Improvement |
|---|---|---|---|---|
| 2025 | $1,637 | $182,270 | -- | -- |
| 2024 | $1,637 | $168,685 | $0 | $0 |
| 2023 | $1,666 | $171,875 | $0 | $0 |
| 2022 | $1,783 | $180,455 | $0 | $0 |
| 2021 | $1,537 | $248,800 | $78,600 | $170,200 |
| 2020 | $1,390 | $218,800 | $65,500 | $153,300 |
| 2019 | $1,200 | $198,800 | $65,500 | $133,300 |
| 2018 | $1,133 | $181,400 | $65,500 | $115,900 |
| 2017 | $1,046 | $89,980 | $0 | $0 |
| 2016 | $913 | $77,550 | $0 | $0 |
| 2015 | $833 | $69,850 | $0 | $0 |
| 2014 | $809 | $68,090 | $0 | $0 |
Source: Public Records
Map
Nearby Homes
- 844 S 200 E Unit 4-304
- 844 S 200 E Unit 4 -201
- 390 S 300 E
- 573 E 300 S
- 298 S St Unit 205
- 296 S St Unit 20
- 324 S St Unit 204
- 2583 E 300 S Unit 21
- 284 N 400 E
- 270 N 500 E
- 440 N 200 E
- 837 S 200 E Unit 5-303
- 837 S 200 E Unit 5-201
- 837 S 200 E Unit 5-301
- 134 W 700 S
- 721 S 110 W
- 265 N 800 E
- 272 E 850 S Unit 7-204
- 272 E 850 S Unit 7-203
- 272 E 850 S Unit 7-201
Your Personal Tour Guide
Ask me questions while you tour the home.