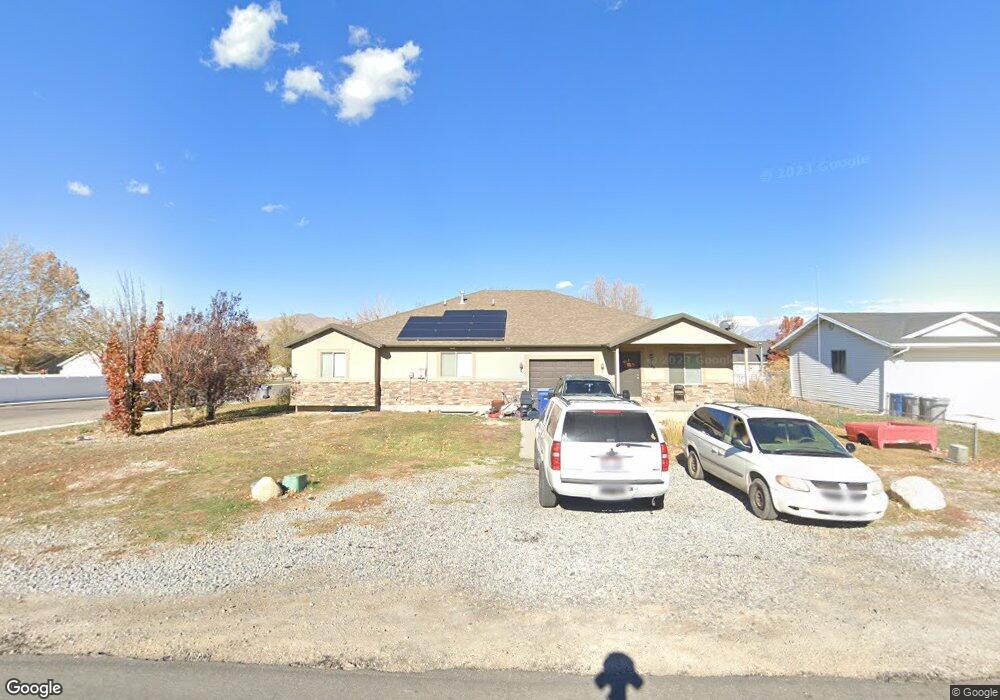
190 W 400 N Santaquin, UT 84655
Estimated Value: $326,000 - $373,451
3
Beds
2
Baths
1,370
Sq Ft
$263/Sq Ft
Est. Value
About This Home
This home is located at 190 W 400 N, Santaquin, UT 84655 and is currently estimated at $360,363, approximately $263 per square foot. 190 W 400 N is a home located in Utah County with nearby schools including Apple Valley Elementary, Payson Junior High School, and Payson High School.
Ownership History
Date
Name
Owned For
Owner Type
Purchase Details
Closed on
Dec 20, 2017
Sold by
Olson Jennifer
Bought by
Kjo Properties Llc
Current Estimated Value
Purchase Details
Closed on
Mar 20, 2014
Sold by
K & J Construction Inc
Bought by
K & J Construction Inc
Home Financials for this Owner
Home Financials are based on the most recent Mortgage that was taken out on this home.
Original Mortgage
$260,000
Interest Rate
4.18%
Mortgage Type
Purchase Money Mortgage
Purchase Details
Closed on
Apr 13, 2010
Sold by
Glines Reece L
Bought by
Olson Kevin
Create a Home Valuation Report for This Property
The Home Valuation Report is an in-depth analysis detailing your home's value as well as a comparison with similar homes in the area
Home Values in the Area
Average Home Value in this Area
Purchase History
| Date | Buyer | Sale Price | Title Company |
|---|---|---|---|
| Kjo Properties Llc | -- | None Available | |
| Olson Jennifer | -- | None Available | |
| K & J Construction Inc | -- | Title West | |
| Olson Kevin | -- | Wasatch Land & Title |
Source: Public Records
Mortgage History
| Date | Status | Borrower | Loan Amount |
|---|---|---|---|
| Previous Owner | K & J Construction Inc | $260,000 |
Source: Public Records
Tax History Compared to Growth
Tax History
| Year | Tax Paid | Tax Assessment Tax Assessment Total Assessment is a certain percentage of the fair market value that is determined by local assessors to be the total taxable value of land and additions on the property. | Land | Improvement |
|---|---|---|---|---|
| 2025 | $3,753 | $386,600 | $81,800 | $304,800 |
| 2024 | $3,753 | $373,700 | $0 | $0 |
| 2023 | $3,306 | $330,300 | $0 | $0 |
| 2022 | $2,683 | $276,500 | $69,200 | $207,300 |
| 2021 | $1,533 | $244,900 | $48,600 | $196,300 |
| 2020 | $1,465 | $226,800 | $48,600 | $178,200 |
| 2019 | $1,352 | $214,000 | $48,600 | $165,400 |
| 2018 | $1,288 | $194,400 | $48,600 | $145,800 |
| 2017 | $1,326 | $106,920 | $0 | $0 |
| 2016 | $1,137 | $89,815 | $0 | $0 |
| 2015 | $1,107 | $85,800 | $0 | $0 |
| 2014 | $1,067 | $82,500 | $0 | $0 |
Source: Public Records
Map
Nearby Homes
- 600 N Center St
- 921 N 160 E
- 921 N 160 E Unit 12
- 931 N 160 E Unit 11
- 922 N 160 E Unit 20
- 932 N 160 E Unit 21
- 162 W 690 N
- 369 N 500 W Unit 3
- 43 N 300 W
- 348 N 200 E
- 41 W 770 N
- 1700 Farmhouse Plan at Tanner Flats
- 2400 Farmhouse Plan at Tanner Flats
- Pendleton Plan at Silver Oaks
- 683 W Empress St Unit 80
- 153 E Main St Unit B
- 685 Empress St Unit 79
- 689 Empress St Unit 78
- 49 S 100 E
- 923 N 200 E