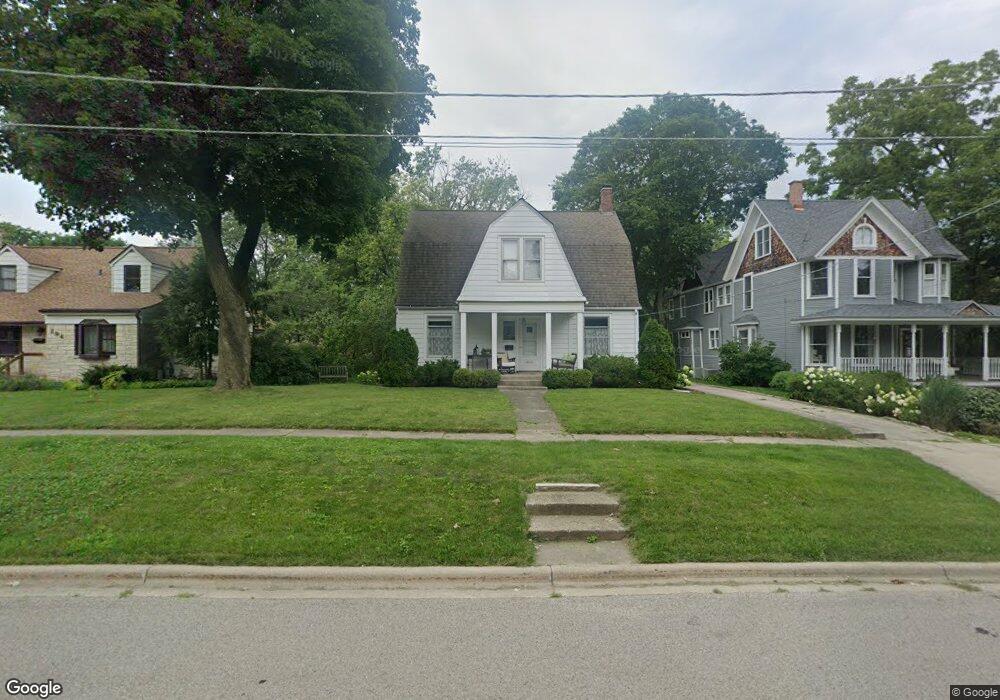
190 Westerfield Place Grayslake, IL 60030
Estimated Value: $319,000 - $365,000
3
Beds
1
Bath
1,430
Sq Ft
$234/Sq Ft
Est. Value
About This Home
This home is located at 190 Westerfield Place, Grayslake, IL 60030 and is currently estimated at $334,413, approximately $233 per square foot. 190 Westerfield Place is a home located in Lake County with nearby schools including Woodview School, Frederick School, and Grayslake Middle School.
Ownership History
Date
Name
Owned For
Owner Type
Purchase Details
Closed on
Oct 26, 1999
Sold by
Gagin John D and Gagin John D
Bought by
Klees John F and Klees Mary E
Current Estimated Value
Home Financials for this Owner
Home Financials are based on the most recent Mortgage that was taken out on this home.
Original Mortgage
$136,500
Outstanding Balance
$41,577
Interest Rate
7.72%
Estimated Equity
$292,836
Purchase Details
Closed on
Jun 13, 1994
Sold by
Rockenbach Douglas and Rockenbach Bonnie
Bought by
Gagin John D and Gagin Milissa C
Home Financials for this Owner
Home Financials are based on the most recent Mortgage that was taken out on this home.
Original Mortgage
$125,600
Interest Rate
8.45%
Purchase Details
Closed on
Dec 16, 1993
Sold by
Ferguson Evelyn H
Bought by
Rockenbach Douglas and Rockenbach Bonnie
Create a Home Valuation Report for This Property
The Home Valuation Report is an in-depth analysis detailing your home's value as well as a comparison with similar homes in the area
Home Values in the Area
Average Home Value in this Area
Purchase History
| Date | Buyer | Sale Price | Title Company |
|---|---|---|---|
| Klees John F | $182,000 | Chicago Title Insurance Co | |
| Gagin John D | $157,000 | Intercounty Title Company | |
| Rockenbach Douglas | $100,000 | Intercounty Title Company |
Source: Public Records
Mortgage History
| Date | Status | Borrower | Loan Amount |
|---|---|---|---|
| Open | Klees John F | $136,500 | |
| Previous Owner | Gagin John D | $125,600 | |
| Closed | Klees John F | $27,300 |
Source: Public Records
Tax History Compared to Growth
Tax History
| Year | Tax Paid | Tax Assessment Tax Assessment Total Assessment is a certain percentage of the fair market value that is determined by local assessors to be the total taxable value of land and additions on the property. | Land | Improvement |
|---|---|---|---|---|
| 2024 | $8,351 | $90,385 | $34,013 | $56,372 |
| 2023 | $7,598 | $79,001 | $29,729 | $49,272 |
| 2022 | $7,598 | $69,353 | $21,407 | $47,946 |
| 2021 | $7,502 | $66,660 | $20,576 | $46,084 |
| 2020 | $9,633 | $79,873 | $19,578 | $60,295 |
| 2019 | $9,299 | $76,631 | $18,783 | $57,848 |
| 2018 | $8,874 | $73,912 | $24,439 | $49,473 |
| 2017 | $8,822 | $69,525 | $22,988 | $46,537 |
| 2016 | $8,457 | $64,179 | $21,220 | $42,959 |
| 2015 | $8,228 | $58,632 | $19,386 | $39,246 |
| 2014 | $6,479 | $47,180 | $17,715 | $29,465 |
| 2012 | $6,401 | $49,274 | $18,501 | $30,773 |
Source: Public Records
Map
Nearby Homes
- 146 Westerfield Place
- 121 Park Ave
- 390 N Garfield Blvd
- 11 S Lake St
- 10 Glen St
- 349 Brittain Ave
- 101 Burton St
- 533 Cannon Ball Dr
- 102 Soo Line Dr
- 42 Village Station Ln
- 220 Bluff Ct
- 231 Lionel Dr
- 270 Lionel Dr
- 228 Station Park Cir
- 566 Chard Ct
- 418 Flanders Ln
- 34110 S Circle Dr
- 337 Woodland Dr Unit 6
- 399 Banbury Ln
- 618 Barron Blvd
- 194 Westerfield Place
- 182 Westerfield Place
- 191 Westerfield Place
- 193 Westerfield Place
- 183 Westerfield Place
- 178 Westerfield Place Unit 4C
- 181 Westerfield Place
- 238 Westerfield Place
- 171 Westerfield Place
- 195 Westerfield Place
- 199 Westerfield Place
- 371 White St
- 162 Westerfield Place
- 187 S Seymour Ave
- 191 S Seymour Ave
- 183 S Seymour Ave
- 167 Westerfield Place
- 195 S Seymour Ave
- 179 S Seymour Ave
- 250 Westerfield Place