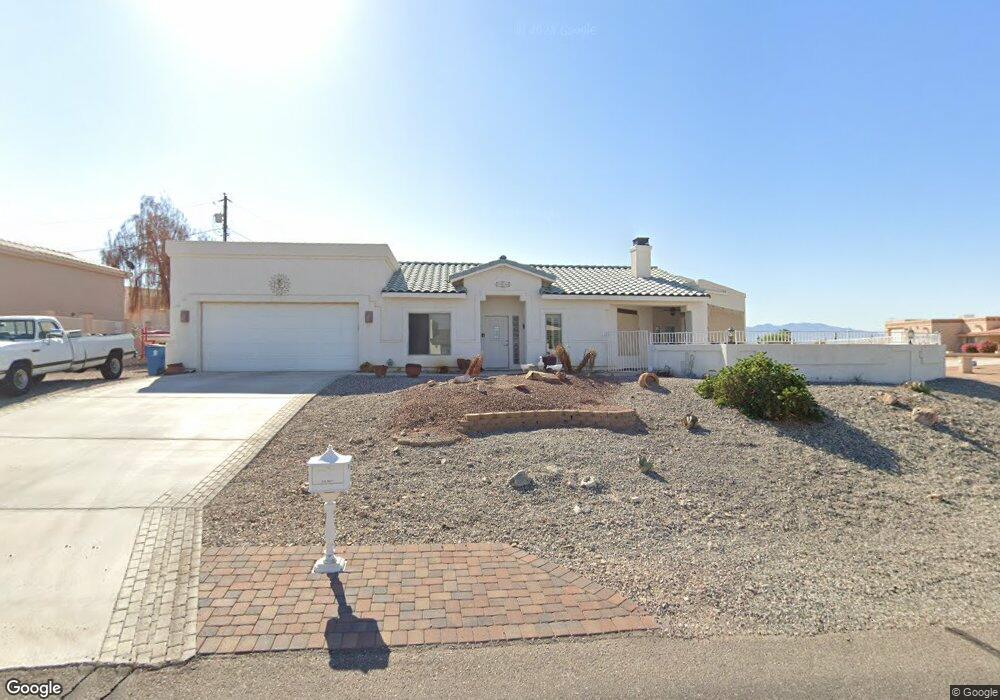
1900 Crescent Dr Lake Havasu City, AZ 86404
Estimated Value: $611,403 - $705,000
3
Beds
2
Baths
1,829
Sq Ft
$365/Sq Ft
Est. Value
About This Home
This home is located at 1900 Crescent Dr, Lake Havasu City, AZ 86404 and is currently estimated at $667,851, approximately $365 per square foot. 1900 Crescent Dr is a home located in Mohave County with nearby schools including Nautilus Elementary School, Thunderbolt Middle School, and Lake Havasu High School.
Ownership History
Date
Name
Owned For
Owner Type
Purchase Details
Closed on
Nov 15, 2010
Sold by
Haukon Thomas and Haukon Katherin
Bought by
Thomas & Katherine Haukom Trust
Current Estimated Value
Home Financials for this Owner
Home Financials are based on the most recent Mortgage that was taken out on this home.
Original Mortgage
$243,600
Outstanding Balance
$165,327
Interest Rate
4.84%
Mortgage Type
New Conventional
Estimated Equity
$502,524
Purchase Details
Closed on
Jul 10, 2006
Sold by
Jansen Gary A and Jansen Dixie C
Bought by
Haukom Thomas and Haukom Katherine
Home Financials for this Owner
Home Financials are based on the most recent Mortgage that was taken out on this home.
Original Mortgage
$335,900
Interest Rate
6.57%
Mortgage Type
New Conventional
Purchase Details
Closed on
Dec 23, 1999
Sold by
Horowitz Allen M
Bought by
Jansen Gary A and Jansen Dixie C
Create a Home Valuation Report for This Property
The Home Valuation Report is an in-depth analysis detailing your home's value as well as a comparison with similar homes in the area
Home Values in the Area
Average Home Value in this Area
Purchase History
| Date | Buyer | Sale Price | Title Company |
|---|---|---|---|
| Thomas & Katherine Haukom Trust | -- | None Available | |
| Haukom Thomas | $419,900 | Capital Title Agency Inc | |
| Jansen Gary A | $20,000 | Transnation Title Ins Co |
Source: Public Records
Mortgage History
| Date | Status | Borrower | Loan Amount |
|---|---|---|---|
| Open | Thomas & Katherine Haukom Trust | $243,600 | |
| Closed | Haukom Thomas | $335,900 |
Source: Public Records
Tax History Compared to Growth
Tax History
| Year | Tax Paid | Tax Assessment Tax Assessment Total Assessment is a certain percentage of the fair market value that is determined by local assessors to be the total taxable value of land and additions on the property. | Land | Improvement |
|---|---|---|---|---|
| 2026 | $1,265 | -- | -- | -- |
| 2025 | $2,564 | $46,662 | $0 | $0 |
| 2024 | $2,564 | $56,059 | $0 | $0 |
| 2023 | $2,564 | $46,468 | $0 | $0 |
| 2022 | $2,454 | $35,631 | $0 | $0 |
| 2021 | $2,644 | $32,643 | $0 | $0 |
| 2019 | $2,509 | $28,153 | $0 | $0 |
| 2018 | $2,422 | $27,771 | $0 | $0 |
| 2017 | $2,397 | $26,764 | $0 | $0 |
| 2016 | $2,166 | $29,676 | $0 | $0 |
| 2015 | $2,073 | $22,917 | $0 | $0 |
Source: Public Records
Map
Nearby Homes
- 1880 Glorietta Dr
- 1948 Burgundy Dr
- 1825 Deer Run Dr
- 1921 Burgundy Ln
- 1929 Burgundy Ln
- 1940 Gold Dust Dr
- 1993 Burgundy Dr
- 1981 Deer Run Dr
- 1718 Sailing Hawks Dr
- 1733 Sailing Hawks Dr
- 1851 Laramie Dr
- 2050 Burgundy Dr
- 1651 Sailing Hawks Dr
- 1651 Sailing Hawks Dr Unit 139
- 1485 Wagner Dr
- 1601 Sailing Hawks Dr
- 1601 Sailing Hawks Dr Unit 14
- 1361 Tamarack Dr
- 2050 Palo Verde Blvd N
- 1790 Cessna Bay
- 0000 Crescent Model On Your Lot
- 1580 Autumn Dr
- 1910 Crescent Dr
- 1600 Autumn Dr
- 1591 Autumn Dr
- 1889 Deer Run Cir
- 1920 Crescent Dr
- 1581 Autumn Dr
- 1893 Deer Run Cir
- 1911 Crescent Dr
- 1601 Autumn Dr
- 1601 Autumn Dr
- 1571 Autumn Dr
- 1610 Autumn Dr
- 1873 Deer Run Dr
- 1921 Crescent Dr
- 1930 Crescent Dr
- 1885 Deer Run Dr
- 1561 Autumn Dr
- 1931 Crescent Dr