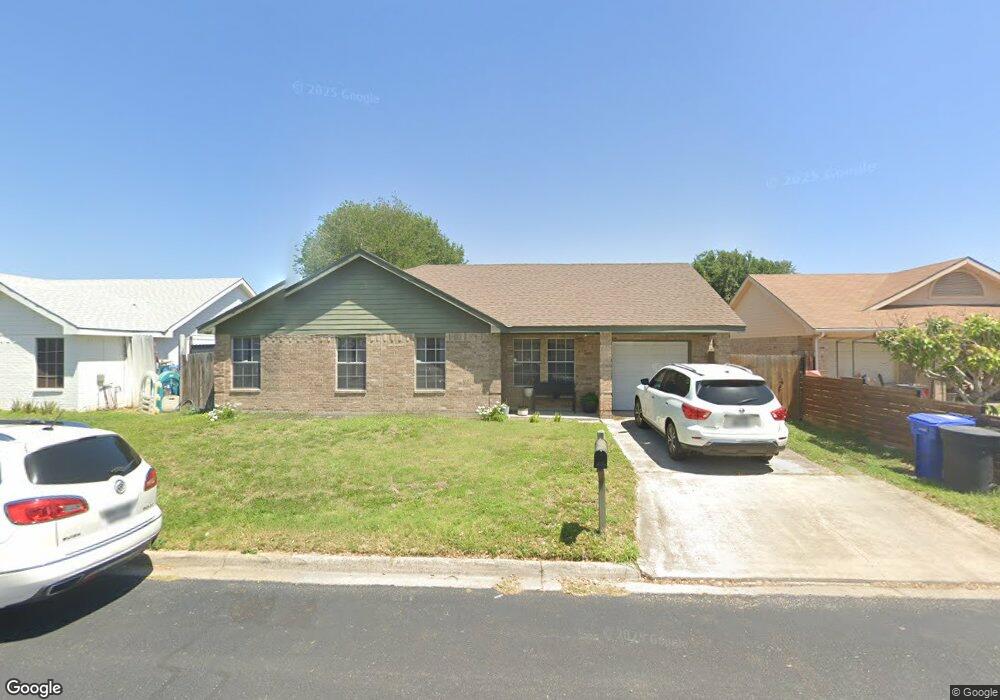
1900 Grambling Ave Unit 2 McAllen, TX 78504
Estimated Value: $166,996 - $190,000
3
Beds
3
Baths
1,042
Sq Ft
$173/Sq Ft
Est. Value
About This Home
This home is located at 1900 Grambling Ave Unit 2, McAllen, TX 78504 and is currently estimated at $180,749, approximately $173 per square foot. 1900 Grambling Ave Unit 2 is a home located in Hidalgo County with nearby schools including Dr Pablo Perez Elementary School, Morris Middle School, and McAllen High School.
Ownership History
Date
Name
Owned For
Owner Type
Purchase Details
Closed on
Feb 28, 2011
Sold by
Citimortgage Inc
Bought by
Delapena Raul and Delapena Mayela
Current Estimated Value
Home Financials for this Owner
Home Financials are based on the most recent Mortgage that was taken out on this home.
Original Mortgage
$38,500
Interest Rate
4.92%
Mortgage Type
New Conventional
Purchase Details
Closed on
Nov 15, 2010
Sold by
Aragon Michelle A and Mortgage Electronic Registrati
Bought by
Citimortgage Inc
Purchase Details
Closed on
Oct 6, 2006
Sold by
Obra Homes Inc
Bought by
Aragon Michelle A
Home Financials for this Owner
Home Financials are based on the most recent Mortgage that was taken out on this home.
Original Mortgage
$68,000
Interest Rate
9%
Mortgage Type
Purchase Money Mortgage
Purchase Details
Closed on
Jul 4, 2006
Sold by
Sandoval Reynaldo and Sandoval Maria Alvarez
Bought by
Obra Homes Inc
Create a Home Valuation Report for This Property
The Home Valuation Report is an in-depth analysis detailing your home's value as well as a comparison with similar homes in the area
Purchase History
| Date | Buyer | Sale Price | Title Company |
|---|---|---|---|
| Delapena Raul | $38,500 | First American Title Company | |
| Citimortgage Inc | $75,859 | None Available | |
| Aragon Michelle A | -- | San Jacinto Title Services | |
| Obra Homes Inc | $64,000 | None Available |
Source: Public Records
Mortgage History
| Date | Status | Borrower | Loan Amount |
|---|---|---|---|
| Previous Owner | Delapena Raul | $38,500 | |
| Previous Owner | Aragon Michelle A | $68,000 |
Source: Public Records
Tax History
| Year | Tax Paid | Tax Assessment Tax Assessment Total Assessment is a certain percentage of the fair market value that is determined by local assessors to be the total taxable value of land and additions on the property. | Land | Improvement |
|---|---|---|---|---|
| 2025 | $3,262 | $141,159 | $52,728 | $88,431 |
| 2024 | $3,262 | $138,677 | $26,477 | $112,200 |
| 2023 | $3,293 | $139,967 | $26,477 | $113,490 |
| 2022 | $3,184 | $128,412 | $26,477 | $101,935 |
| 2021 | $2,822 | $110,466 | $26,477 | $83,989 |
| 2020 | $2,547 | $99,843 | $22,630 | $77,213 |
| 2019 | $2,403 | $94,751 | $22,630 | $72,121 |
| 2018 | $1,926 | $75,802 | $21,499 | $54,303 |
| 2017 | $1,899 | $74,444 | $21,499 | $52,945 |
| 2016 | $1,899 | $74,444 | $21,499 | $52,945 |
| 2015 | $1,836 | $64,755 | $15,841 | $48,914 |
Source: Public Records
Map
Nearby Homes
- 2000 Grambling Ave
- 1824 Harvard Ave
- 2100 Emory Ave Unit 291
- 1913 Fordham Ave
- 1700 Frontera Rd
- 8904 N 21st St
- 2316 Fairmont Ave
- 8413 N Main St
- 2320 Fairmont Ave
- 8210 N 23rd Ln
- 1700 Dartmouth Ave
- 2249 Dartmouth Ave
- 3705 Zenker Ave
- 1921 Baylor Ave
- 8437 N 24th St
- 3301 Northgate Ln
- 900 Northgate Ln
- 2500 Duke Ave
- 2505 Fullerton Ave
- 3604 Yellowhammer Ave
- 1812 Grambling Ave
- 1904 Grambling Ave
- 1901 Grayson Ave
- 1813 Grayson Ave
- 1905 Grayson Ave
- 1808 Grambling Ave
- 1901 Grambling Ave
- 1908 Grambling Ave
- 1905 Grambling Ave
- 1813 Grambling Ave
- 1809 Grayson Ave
- 1909 Grayson Ave
- 1809 Grambling Ave
- 1909 Grambling Ave
- 1804 Grambling Ave
- 1912 Grambling Ave
- 1900 Grayson Ave
- 1805 Grayson Ave
- 1900 Fairmont Ave
- 1913 Grayson Ave
Your Personal Tour Guide
Ask me questions while you tour the home.