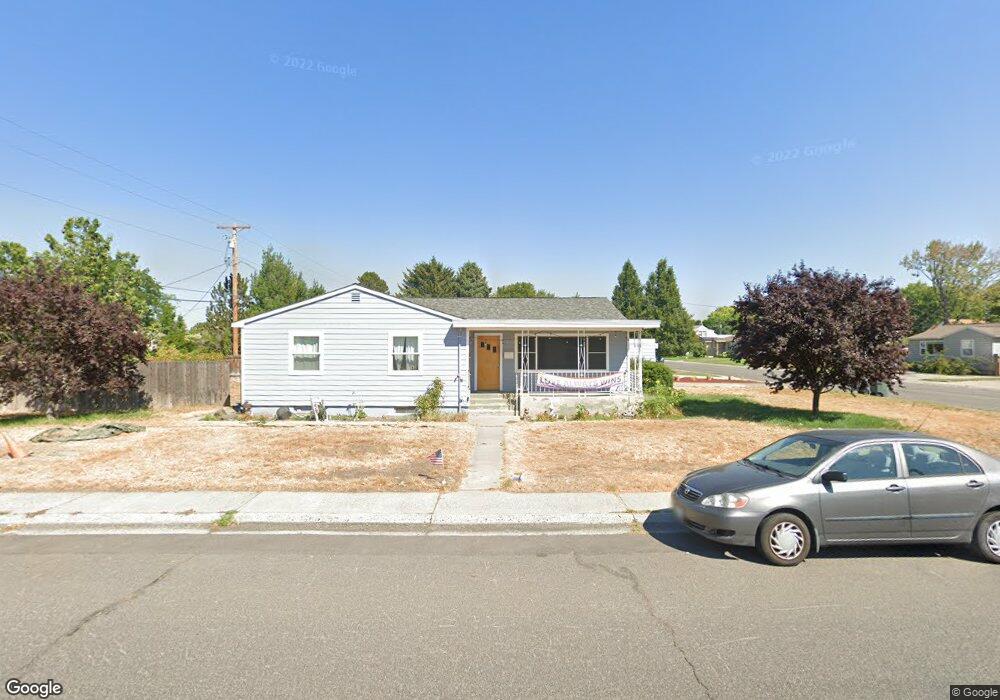
1900 Howell Ave Richland, WA 99354
Estimated Value: $438,000 - $599,000
3
Beds
2
Baths
1,459
Sq Ft
$331/Sq Ft
Est. Value
About This Home
This home is located at 1900 Howell Ave, Richland, WA 99354 and is currently estimated at $482,595, approximately $330 per square foot. 1900 Howell Ave is a home located in Benton County with nearby schools including Jefferson Elementary School, Chief Joseph Middle School, and Hanford High School.
Ownership History
Date
Name
Owned For
Owner Type
Purchase Details
Closed on
Aug 28, 2009
Sold by
Barrow Jason M and Barrow Leona
Bought by
Ovens Bryan M and Ross Misty A
Current Estimated Value
Home Financials for this Owner
Home Financials are based on the most recent Mortgage that was taken out on this home.
Original Mortgage
$186,558
Outstanding Balance
$121,387
Interest Rate
5.09%
Mortgage Type
FHA
Estimated Equity
$361,208
Purchase Details
Closed on
Apr 28, 2005
Sold by
Johnson Harry G and Johnson Margaret E
Bought by
Barrow Jason M
Home Financials for this Owner
Home Financials are based on the most recent Mortgage that was taken out on this home.
Original Mortgage
$32,220
Interest Rate
5.92%
Mortgage Type
Stand Alone Second
Create a Home Valuation Report for This Property
The Home Valuation Report is an in-depth analysis detailing your home's value as well as a comparison with similar homes in the area
Home Values in the Area
Average Home Value in this Area
Purchase History
| Date | Buyer | Sale Price | Title Company |
|---|---|---|---|
| Ovens Bryan M | $190,000 | Benton Franklin Title Co | |
| Barrow Jason M | $161,100 | Benton Franklin Titl | |
| Barrow Jason M | -- | Benton Franklin Titl |
Source: Public Records
Mortgage History
| Date | Status | Borrower | Loan Amount |
|---|---|---|---|
| Open | Ovens Bryan M | $186,558 | |
| Previous Owner | Barrow Jason M | $32,220 | |
| Previous Owner | Barrow Jason M | $128,880 |
Source: Public Records
Tax History Compared to Growth
Tax History
| Year | Tax Paid | Tax Assessment Tax Assessment Total Assessment is a certain percentage of the fair market value that is determined by local assessors to be the total taxable value of land and additions on the property. | Land | Improvement |
|---|---|---|---|---|
| 2024 | $3,585 | $399,970 | $50,000 | $349,970 |
| 2023 | $3,585 | $382,020 | $50,000 | $332,020 |
| 2022 | $3,727 | $337,150 | $50,000 | $287,150 |
| 2021 | $3,775 | $337,150 | $50,000 | $287,150 |
| 2020 | $2,829 | $328,180 | $50,000 | $278,180 |
| 2019 | $2,247 | $231,710 | $36,000 | $195,710 |
| 2018 | $2,319 | $197,960 | $36,000 | $161,960 |
| 2017 | $2,039 | $170,970 | $36,000 | $134,970 |
| 2016 | $2,010 | $170,970 | $36,000 | $134,970 |
| 2015 | $2,048 | $170,970 | $36,000 | $134,970 |
| 2014 | -- | $170,970 | $36,000 | $134,970 |
| 2013 | -- | $170,970 | $36,000 | $134,970 |
Source: Public Records
Map
Nearby Homes
- 78 Whitten St
- 1920 Howell Ave
- 1923 Hood Ave
- 1947 Hetrick St
- 515 Blue St
- 517 Catskill St
- 2110 Davison Ave
- 1609 Judson Ave
- 1914 Mahan Ave
- 1962 Mahan Ave
- 1435 Johnston Ave
- 324 Saint St
- 2021 Mahan Ave Unit J-6
- 2021 Mahan Ave Unit D8
- 2021 Mahan Ave Unit A5
- 2021 Mahan Ave Unit I8
- 2021 Mahan Ave Unit H-7
- 2021 Mahan Ave Unit M7
- 2021 Mahan Ave Unit G1
- 609 Torbett St