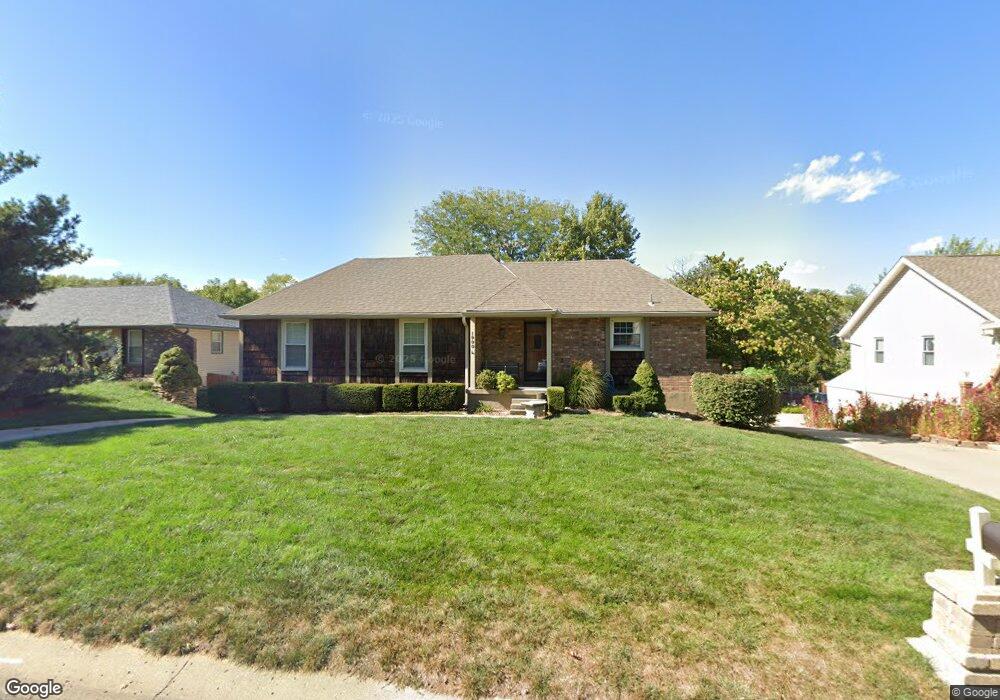
1900 N Lazy Branch Rd Independence, MO 64058
Estimated Value: $232,000 - $271,000
3
Beds
2
Baths
1,467
Sq Ft
$171/Sq Ft
Est. Value
About This Home
This home is located at 1900 N Lazy Branch Rd, Independence, MO 64058 and is currently estimated at $250,384, approximately $170 per square foot. 1900 N Lazy Branch Rd is a home located in Jackson County with nearby schools including Fort Osage High School.
Create a Home Valuation Report for This Property
The Home Valuation Report is an in-depth analysis detailing your home's value as well as a comparison with similar homes in the area
Home Values in the Area
Average Home Value in this Area
Tax History Compared to Growth
Tax History
| Year | Tax Paid | Tax Assessment Tax Assessment Total Assessment is a certain percentage of the fair market value that is determined by local assessors to be the total taxable value of land and additions on the property. | Land | Improvement |
|---|---|---|---|---|
| 2025 | $2,793 | $32,414 | $6,623 | $25,791 |
| 2024 | $2,768 | $31,228 | $4,499 | $26,729 |
| 2023 | $2,768 | $31,228 | $3,830 | $27,398 |
| 2022 | $2,293 | $24,510 | $3,071 | $21,439 |
| 2021 | $2,296 | $24,510 | $3,071 | $21,439 |
| 2020 | $2,224 | $23,404 | $3,071 | $20,333 |
| 2019 | $2,179 | $23,404 | $3,071 | $20,333 |
| 2018 | $1,905 | $20,370 | $2,673 | $17,697 |
| 2017 | $1,648 | $20,370 | $2,673 | $17,697 |
| 2016 | $1,648 | $19,089 | $2,811 | $16,278 |
| 2014 | $1,623 | $18,715 | $2,756 | $15,959 |
Source: Public Records
Map
Nearby Homes
- 2006 N Concord Rd
- 2015 N Lazy Branch Rd
- 1713 N Arapaho Ct
- 18901 E Lynchburg Place N
- 18104 E 17th St N
- 2100 N York St
- 1511 Osage Trail
- 17800 E Whitney Rd
- 18108 E Shoshone Dr
- 2023 N Ethan Ln
- 19204 E 15th St N
- 19706 E 20th St N
- 19117 E 14th St N
- 18729 E 13th Terrace Ct N
- 19201 E 13th Terrace N
- 0 E 24 Highway Cir
- 1620 N Belvidere Ave
- 1801 N Davidson Rd
- 19704 E 14th Terrace N
- 19706 E 14th St N
- 1902 N Lazy Branch Rd
- 1826 N Lazy Branch Rd
- 1901 N Lazy Branch Rd
- 1903 N Lazy Branch Rd
- 1825 N Lazy Branch Rd
- 1904 N Lazy Branch Rd
- 1824 N Lazy Branch Rd
- 1824 N Lazy Branch Rd
- 1905 N Lazy Branch Rd
- 1823 N Lazy Branch Rd
- 1917 Grove Dr
- 1919 N Grove Dr
- 1822 N Lazy Branch Rd
- 1906 N Lazy Branch Rd
- 1915 Grove Dr
- 1907 N Lazy Branch Rd
- 1821 N Lazy Branch Rd
- 1900 N Concord Rd
- 1902 N Concord Rd
- 1911 N Grove Dr