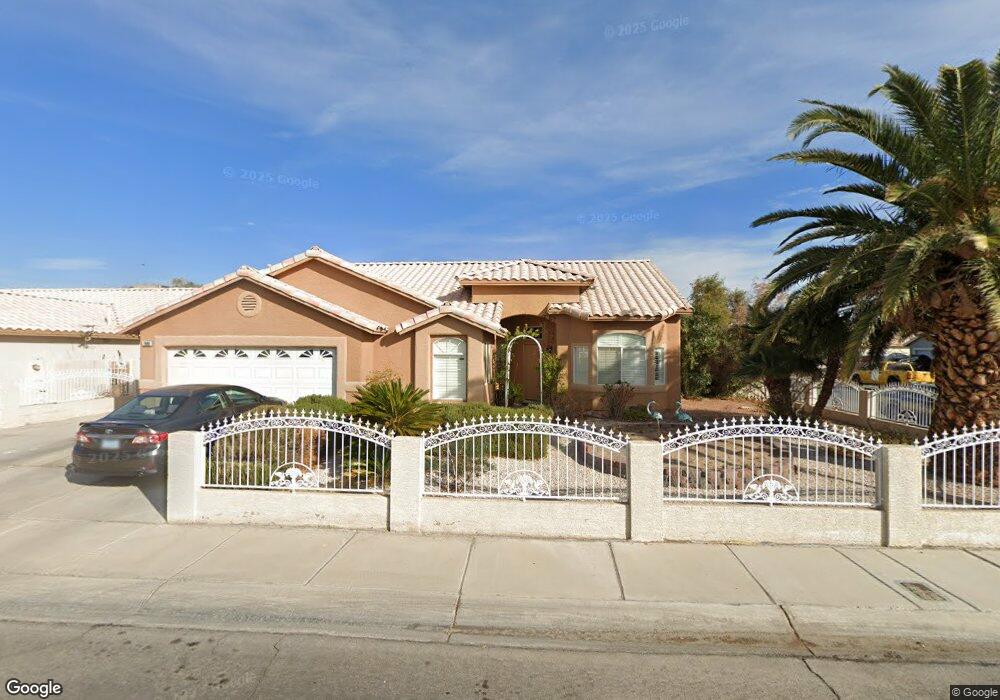
1900 Pink Ice Ct Las Vegas, NV 89106
West Las Vegas NeighborhoodEstimated Value: $397,751 - $446,000
5
Beds
2
Baths
2,046
Sq Ft
$201/Sq Ft
Est. Value
About This Home
This home is located at 1900 Pink Ice Ct, Las Vegas, NV 89106 and is currently estimated at $411,438, approximately $201 per square foot. 1900 Pink Ice Ct is a home located in Clark County with nearby schools including Matt Kelly Elementary School, West Prepatory Academy At Charlles I West Hall Sec, and Western High School.
Ownership History
Date
Name
Owned For
Owner Type
Purchase Details
Closed on
Feb 6, 2021
Sold by
George Saramma John and George John
Bought by
George Saramma John and George John
Current Estimated Value
Home Financials for this Owner
Home Financials are based on the most recent Mortgage that was taken out on this home.
Original Mortgage
$192,300
Outstanding Balance
$141,269
Interest Rate
2.6%
Mortgage Type
New Conventional
Estimated Equity
$270,169
Purchase Details
Closed on
Dec 31, 2001
Sold by
George John and George Saramma J
Bought by
George John and George Saramma J
Home Financials for this Owner
Home Financials are based on the most recent Mortgage that was taken out on this home.
Original Mortgage
$160,000
Interest Rate
6.73%
Purchase Details
Closed on
Nov 30, 1995
Sold by
Ldp Inc
Bought by
George John and George Saramma J
Home Financials for this Owner
Home Financials are based on the most recent Mortgage that was taken out on this home.
Original Mortgage
$118,900
Interest Rate
7.42%
Create a Home Valuation Report for This Property
The Home Valuation Report is an in-depth analysis detailing your home's value as well as a comparison with similar homes in the area
Home Values in the Area
Average Home Value in this Area
Purchase History
| Date | Buyer | Sale Price | Title Company |
|---|---|---|---|
| George Saramma John | -- | Old Republic Title Co Of Nv | |
| George John | -- | Nevada Title Company | |
| George John | $128,000 | First American Title Co |
Source: Public Records
Mortgage History
| Date | Status | Borrower | Loan Amount |
|---|---|---|---|
| Open | George Saramma John | $192,300 | |
| Closed | George John | $160,000 | |
| Closed | George John | $118,900 |
Source: Public Records
Tax History Compared to Growth
Tax History
| Year | Tax Paid | Tax Assessment Tax Assessment Total Assessment is a certain percentage of the fair market value that is determined by local assessors to be the total taxable value of land and additions on the property. | Land | Improvement |
|---|---|---|---|---|
| 2025 | $1,271 | $91,207 | $26,950 | $64,257 |
| 2024 | $1,235 | $91,207 | $26,950 | $64,257 |
| 2023 | $945 | $89,341 | $28,175 | $61,166 |
| 2022 | $1,199 | $79,373 | $23,345 | $56,028 |
| 2021 | $1,217 | $73,988 | $20,528 | $53,460 |
| 2020 | $1,127 | $73,334 | $20,125 | $53,209 |
| 2019 | $1,056 | $65,344 | $12,880 | $52,464 |
| 2018 | $1,008 | $61,619 | $11,270 | $50,349 |
| 2017 | $2,001 | $61,051 | $10,063 | $50,988 |
| 2016 | $945 | $51,693 | $5,950 | $45,743 |
| 2015 | $942 | $34,714 | $4,200 | $30,514 |
| 2014 | $914 | $33,179 | $3,080 | $30,099 |
Source: Public Records
Map
Nearby Homes
- 1310 N Tonopah Dr
- 2100 Port Ave
- 1918 King Hill St
- 1401 Mezpah Dr
- 1928 King Hill St
- 1936 King Hill St
- 1604 Luning Dr
- 1901 Manhattan Dr
- 2304 Shady Hill Ave
- 1101 Leonard Ave
- 1212 Eleanor Ave
- 1641 K St
- 1908 Hart Ave
- 1904 Hart Ave
- 1636 J St
- 1648 J St
- 2508 Ellingson Dr
- 2203 Langdon Way
- 1301 Madison Ave
- 1980 Hydrangea Place
- 1904 Pink Ice Ct
- 1901 Rose Coral Ave
- 1908 Pink Ice Ct
- 1700 Crystal Gem St
- 1704 Crystal Gem St
- 1901 Pink Ice Ct
- 1616 Crystal Gem St
- 1905 Pink Ice Ct
- 1909 Rose Coral Ave
- 1708 Crystal Gem St
- 1612 Crystal Gem St
- 1909 Pink Ice Ct
- 1912 Pink Ice Ct
- 1913 Rose Coral Ave
- 1800 Crystal Gem St
- 1913 Pink Ice Ct
- 1608 Crystal Gem St
- 1900 Rose Coral Ave
- 1900 Garnet Gable Ave
- 1904 Rose Coral Ave