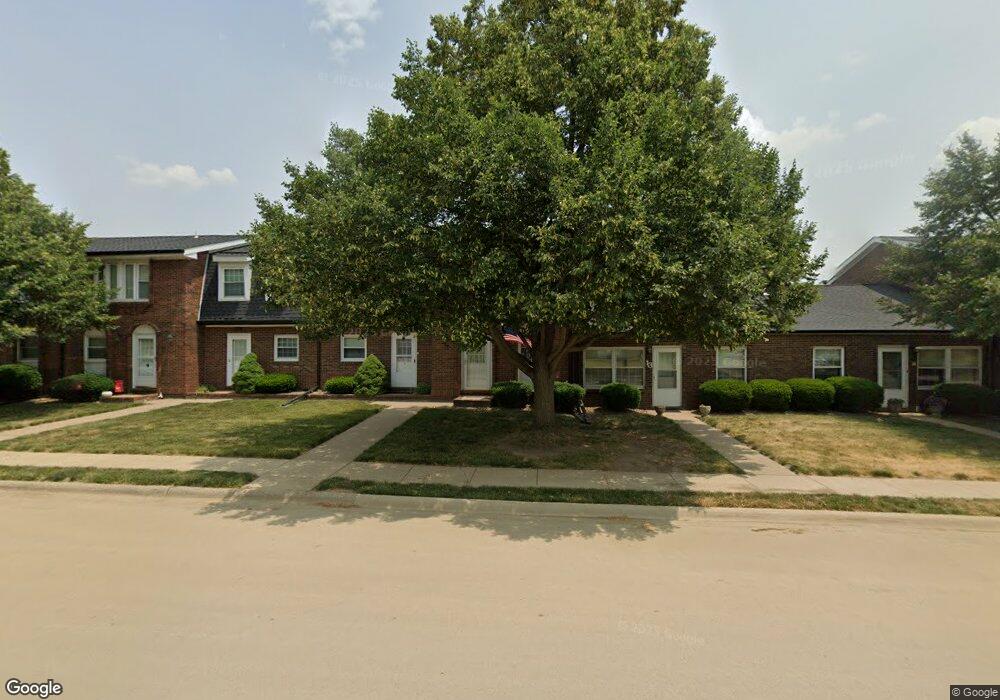
1900 S Second St Unit 6 Morton, IL 61550
Estimated Value: $129,000 - $149,000
2
Beds
2
Baths
1,056
Sq Ft
$134/Sq Ft
Est. Value
About This Home
This home is located at 1900 S Second St Unit 6, Morton, IL 61550 and is currently estimated at $141,553, approximately $134 per square foot. 1900 S Second St Unit 6 is a home located in Tazewell County with nearby schools including Morton High School, Bethel Lutheran School, and Blessed Sacrament School.
Ownership History
Date
Name
Owned For
Owner Type
Purchase Details
Closed on
Aug 2, 2024
Sold by
Myers Jacob D
Bought by
Harris Curtis
Current Estimated Value
Purchase Details
Closed on
Sep 1, 2017
Sold by
Hansen Kimberly L and Hansen Andrew
Bought by
Myers Jacob
Home Financials for this Owner
Home Financials are based on the most recent Mortgage that was taken out on this home.
Original Mortgage
$73,600
Interest Rate
3.93%
Mortgage Type
New Conventional
Purchase Details
Closed on
Jul 22, 2011
Sold by
Hansen Kimberly L
Bought by
Hansen Kimberly L and Hansen Andrew
Purchase Details
Closed on
Aug 17, 2009
Sold by
Schrock Geraldine E
Bought by
Hansen Kimberly L
Home Financials for this Owner
Home Financials are based on the most recent Mortgage that was taken out on this home.
Original Mortgage
$84,000
Interest Rate
5.29%
Mortgage Type
New Conventional
Create a Home Valuation Report for This Property
The Home Valuation Report is an in-depth analysis detailing your home's value as well as a comparison with similar homes in the area
Home Values in the Area
Average Home Value in this Area
Purchase History
| Date | Buyer | Sale Price | Title Company |
|---|---|---|---|
| Harris Curtis | $115,000 | None Listed On Document | |
| Myers Jacob | $92,000 | Miller Title | |
| Hansen Kimberly L | -- | None Available | |
| Hansen Kimberly L | $105,000 | Pekin Title Llc |
Source: Public Records
Mortgage History
| Date | Status | Borrower | Loan Amount |
|---|---|---|---|
| Previous Owner | Myers Jacob | $73,600 | |
| Previous Owner | Hansen Kimberly L | $84,000 |
Source: Public Records
Tax History
| Year | Tax Paid | Tax Assessment Tax Assessment Total Assessment is a certain percentage of the fair market value that is determined by local assessors to be the total taxable value of land and additions on the property. | Land | Improvement |
|---|---|---|---|---|
| 2024 | $2,100 | $37,180 | $7,080 | $30,100 |
| 2023 | $2,100 | $34,640 | $6,600 | $28,040 |
| 2022 | $1,993 | $31,810 | $6,060 | $25,750 |
| 2021 | $1,900 | $30,590 | $5,830 | $24,760 |
| 2020 | $1,836 | $30,280 | $5,770 | $24,510 |
| 2019 | $1,832 | $30,280 | $5,770 | $24,510 |
| 2018 | $1,798 | $30,280 | $5,770 | $24,510 |
| 2017 | $1,391 | $29,980 | $5,710 | $24,270 |
| 2016 | $1,356 | $29,980 | $5,710 | $24,270 |
| 2015 | $1,641 | $0 | $0 | $0 |
| 2013 | $1,624 | $33,910 | $5,500 | $28,410 |
Source: Public Records
Map
Nearby Homes
- 1220 S Main St
- 219 W Birchwood St
- 525 Brentwood Rd
- 640 S 4th Ave Unit 15
- 420 Brentwood Rd Unit 201
- 109 W Chicago St
- 407 E Jefferson St
- 226 N 4th Ave
- 18775 Unsicker Rd
- 1214 Whippoorwill Dr
- 452 N Bauman Ave
- 101 N Oregon Ave
- 523 N Main St
- 313 N Nebraska Ave
- 916 E Emerson St
- 505 E Tyler St
- 354 N Nebraska Ave
- 430 N Montana Ave
- 353 Pocono Ave
- 501-503 Pierce St
- 1900 S Second St Unit 10
- 1900 S Second St Unit 12
- 1900 S Second St Unit 11
- 1900 S Second St
- 1900 S Second Ave Unit 4
- 1900 S Second Ave Unit 12
- 1900 S Second St
- 1900 S Second St Unit 2
- 1900 S Second St Unit 4
- 1900 S 2nd Ave Unit 4
- 1900 S 2nd Ave
- 1900 S 2nd Ave Unit 13
- 1900 S 2nd Ave Unit 12
- 1900 S 2nd Ave Unit 11
- 1900 S 2nd Ave Unit 10
- 1900 S 2nd Ave Unit 9
- 1900 S 2nd Ave Unit 8
- 1900 S 2nd Ave Unit 7
- 1900 S 2nd Ave Unit 6
- 1900 S 2nd Ave Unit 5
Your Personal Tour Guide
Ask me questions while you tour the home.