Estimated Value: $239,801 - $286,000
3
Beds
2
Baths
1,488
Sq Ft
$177/Sq Ft
Est. Value
About This Home
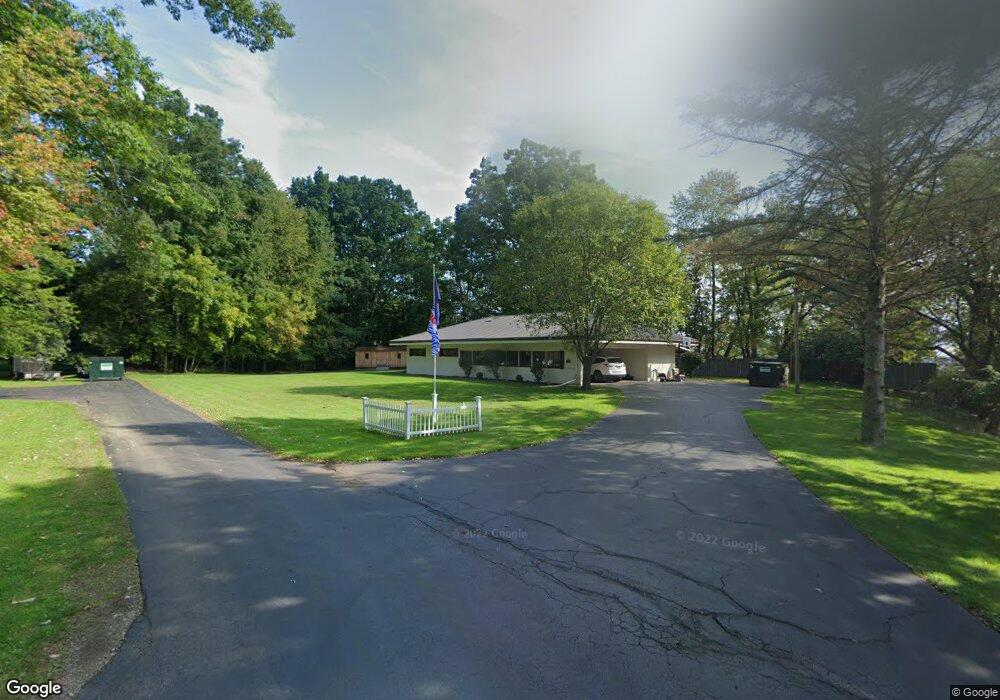
This home is located at 1900 W Franklin St, Olean, NY 14760 and is currently estimated at $262,700, approximately $176 per square foot. 1900 W Franklin St is a home located in Cattaraugus County with nearby schools including Allegany-Limestone Elementary School, Allegany-Limestone Middle-High School, and Southern Tier Catholic School.
Ownership History
Date
Name
Owned For
Owner Type
Purchase Details
Closed on
Jul 1, 2016
Sold by
Havens Nancy A
Bought by
Threehouse Tyler J
Current Estimated Value
Home Financials for this Owner
Home Financials are based on the most recent Mortgage that was taken out on this home.
Original Mortgage
$138,446
Outstanding Balance
$105,222
Interest Rate
3.37%
Mortgage Type
FHA
Estimated Equity
$157,478
Purchase Details
Closed on
Nov 10, 2008
Sold by
Granger Robert
Bought by
Havens Nancy
Purchase Details
Closed on
Jul 9, 2008
Sold by
Granger Robert
Bought by
Havens Nancy
Purchase Details
Closed on
Jan 23, 1998
Purchase Details
Closed on
May 12, 1997
Sold by
Bubbs Robert and Bubbs Susan R
Bought by
Granger Robertr and Granger Nancy
Purchase Details
Closed on
Oct 13, 1994
Sold by
Eaton Daniel F
Bought by
Granger Robert L and Granger Nancy A
Create a Home Valuation Report for This Property
The Home Valuation Report is an in-depth analysis detailing your home's value as well as a comparison with similar homes in the area
Home Values in the Area
Average Home Value in this Area
Purchase History
| Date | Buyer | Sale Price | Title Company |
|---|---|---|---|
| Threehouse Tyler J | $141,000 | Tyler Threehouse | |
| Havens Nancy | -- | Robert E Mountain Jr | |
| Havens Nancy | -- | Robert E Mountain Jr | |
| -- | -- | -- | |
| Granger Robertr | -- | -- | |
| Granger Robert L | -- | -- |
Source: Public Records
Mortgage History
| Date | Status | Borrower | Loan Amount |
|---|---|---|---|
| Open | Threehouse Tyler J | $138,446 |
Source: Public Records
Tax History
| Year | Tax Paid | Tax Assessment Tax Assessment Total Assessment is a certain percentage of the fair market value that is determined by local assessors to be the total taxable value of land and additions on the property. | Land | Improvement |
|---|---|---|---|---|
| 2025 | $4,873 | $141,000 | $15,600 | $125,400 |
| 2024 | $4,873 | $141,000 | $15,600 | $125,400 |
| 2023 | $4,871 | $141,000 | $15,600 | $125,400 |
| 2022 | $4,591 | $141,000 | $15,600 | $125,400 |
| 2021 | $4,650 | $141,000 | $15,600 | $125,400 |
| 2020 | $4,729 | $141,000 | $15,600 | $125,400 |
| 2019 | $1,436 | $141,000 | $15,600 | $125,400 |
| 2018 | $4,875 | $141,000 | $15,600 | $125,400 |
| 2017 | $4,206 | $111,500 | $11,400 | $100,100 |
| 2016 | $3,624 | $111,500 | $11,400 | $100,100 |
| 2015 | -- | $111,500 | $11,400 | $100,100 |
| 2014 | -- | $111,500 | $11,400 | $100,100 |
Source: Public Records
Map
Nearby Homes
- 3031 Nys Route 417
- 3033 W State St
- 3019 Nys Route 417
- 204 N 24th St
- 108 S 18th St
- 111 S 18th St
- 113 S 18th St
- 114 S 17th St
- 121 S 17th St
- 1705 W State St
- 224 S 16th St
- 132 N 15th St
- 210 White Oak Dr
- 216 N 14th St
- 135 N 12th St
- 207 N 11th St
- 129 S 11th St
- 1102 Anderson Ave
- 1759 Four Mile Rd
- 1013 W Sullivan St
- 1896 W Franklin St
- 1892 W Franklin St
- 3121 Cranberry Rd
- 1891 W Franklin St
- 1882 Willard St
- 1876 Willard St
- 1880 W Franklin St
- 3133 Cranberry Rd
- 1883 W Franklin St
- 1866 Willard St
- 3106 Cranberry Rd
- 1862 Willard St
- 1869 W Franklin St
- 1868 W Franklin St
- 3128 Cranberry Rd
- 1860 Willard St
- 1885 Willard St
- 1879 Willard St
- 1887 Willard St
- 1889 Willard St
Your Personal Tour Guide
Ask me questions while you tour the home.