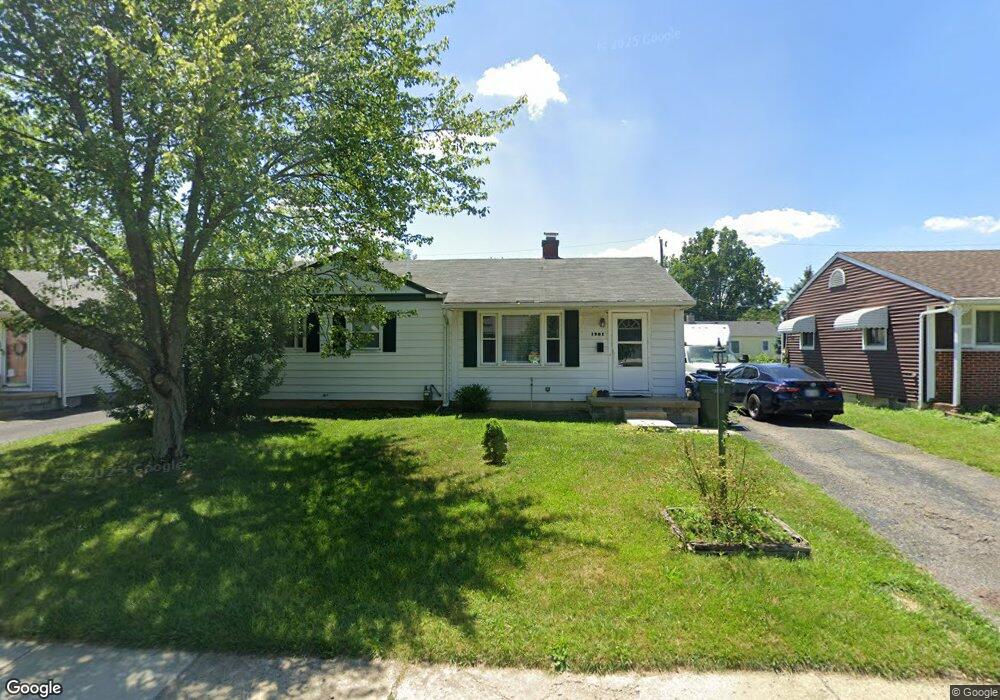
1901 Fenton St Columbus, OH 43224
North Linden NeighborhoodEstimated Value: $133,000 - $210,000
3
Beds
1
Bath
960
Sq Ft
$189/Sq Ft
Est. Value
About This Home
This home is located at 1901 Fenton St, Columbus, OH 43224 and is currently estimated at $181,594, approximately $189 per square foot. 1901 Fenton St is a home located in Franklin County with nearby schools including North Linden Elementary School, Medina Middle School, and Mifflin High School.
Ownership History
Date
Name
Owned For
Owner Type
Purchase Details
Closed on
Jun 14, 2022
Sold by
Galen Deak
Bought by
Deak Galen L and Mcdonald Mary D
Current Estimated Value
Home Financials for this Owner
Home Financials are based on the most recent Mortgage that was taken out on this home.
Original Mortgage
$367,500
Outstanding Balance
$341,584
Interest Rate
5.09%
Mortgage Type
Credit Line Revolving
Estimated Equity
-$159,990
Purchase Details
Closed on
Feb 13, 2018
Sold by
Matt Schilabig
Bought by
Deak Galen
Home Financials for this Owner
Home Financials are based on the most recent Mortgage that was taken out on this home.
Original Mortgage
$60,000
Interest Rate
3.95%
Mortgage Type
Purchase Money Mortgage
Purchase Details
Closed on
Dec 1, 2009
Sold by
Household Realty Corporation
Bought by
Schlabig Matt
Purchase Details
Closed on
Nov 23, 2009
Sold by
Gesick Lorita J and Case #07 Cve 10 014656
Bought by
Household Realty Corporation
Purchase Details
Closed on
Jul 24, 1989
Bought by
Gesick Lorita J
Create a Home Valuation Report for This Property
The Home Valuation Report is an in-depth analysis detailing your home's value as well as a comparison with similar homes in the area
Home Values in the Area
Average Home Value in this Area
Purchase History
| Date | Buyer | Sale Price | Title Company |
|---|---|---|---|
| Deak Galen L | -- | Service Title Agency | |
| Deak Galen | $65,000 | None Available | |
| Schlabig Matt | $46,000 | Attorney | |
| Household Realty Corporation | $60,000 | Attorney | |
| Gesick Lorita J | -- | -- |
Source: Public Records
Mortgage History
| Date | Status | Borrower | Loan Amount |
|---|---|---|---|
| Open | Deak Galen L | $367,500 | |
| Previous Owner | Deak Galen | $60,000 |
Source: Public Records
Tax History Compared to Growth
Tax History
| Year | Tax Paid | Tax Assessment Tax Assessment Total Assessment is a certain percentage of the fair market value that is determined by local assessors to be the total taxable value of land and additions on the property. | Land | Improvement |
|---|---|---|---|---|
| 2024 | $2,379 | $51,910 | $12,250 | $39,660 |
| 2023 | $2,349 | $51,910 | $12,250 | $39,660 |
| 2022 | $1,299 | $24,440 | $5,500 | $18,940 |
| 2021 | $1,301 | $24,440 | $5,500 | $18,940 |
| 2020 | $1,303 | $24,440 | $5,500 | $18,940 |
| 2019 | $1,182 | $19,010 | $4,410 | $14,600 |
| 2018 | $1,088 | $19,010 | $4,410 | $14,600 |
| 2017 | $1,182 | $19,010 | $4,410 | $14,600 |
| 2016 | $1,094 | $16,110 | $4,100 | $12,010 |
| 2015 | $996 | $16,110 | $4,100 | $12,010 |
| 2014 | $999 | $16,110 | $4,100 | $12,010 |
| 2013 | $772 | $24,640 | $4,550 | $20,090 |
Source: Public Records
Map
Nearby Homes
- 1863 Ward Rd
- 4111 Walford St
- 4309 Walford St
- 4217 Hickman Rd
- 1734 Ferris Rd
- 1997 Ferris Rd
- 2023 Ferris Rd
- 2144 Colfax Ave
- 1936 Case Rd
- 2194 Ashley Dr
- 1896 Ormond Ave
- 4057 Estates Place
- 2220 Sale Rd
- 4143 Karl Rd Unit 314
- 4145 Karl Rd Unit 223
- 2283 Ward Rd
- 2219 Sale Rd
- 3750 Dresden St
- 4119 Karl Rd Unit 108
- 4455 Kenfield Rd
- 1895 Fenton St
- 1909 Fenton St
- 1898 E Beaumont Rd
- 1906 E Beaumont Rd
- 1890 E Beaumont Rd
- 1919 Fenton St
- 1887 Fenton St
- 1906 Fenton St
- 1914 E Beaumont Rd
- 1882 E Beaumont Rd
- 1914 Fenton St
- 1879 Fenton St
- 1923 Fenton St
- 1922 Fenton St
- 1922 E Beaumont Rd
- 1874 E Beaumont Rd
- 1882 Fenton St
- 1871 Fenton St
- 1930 Fenton St
- 1895 E Beaumont Rd