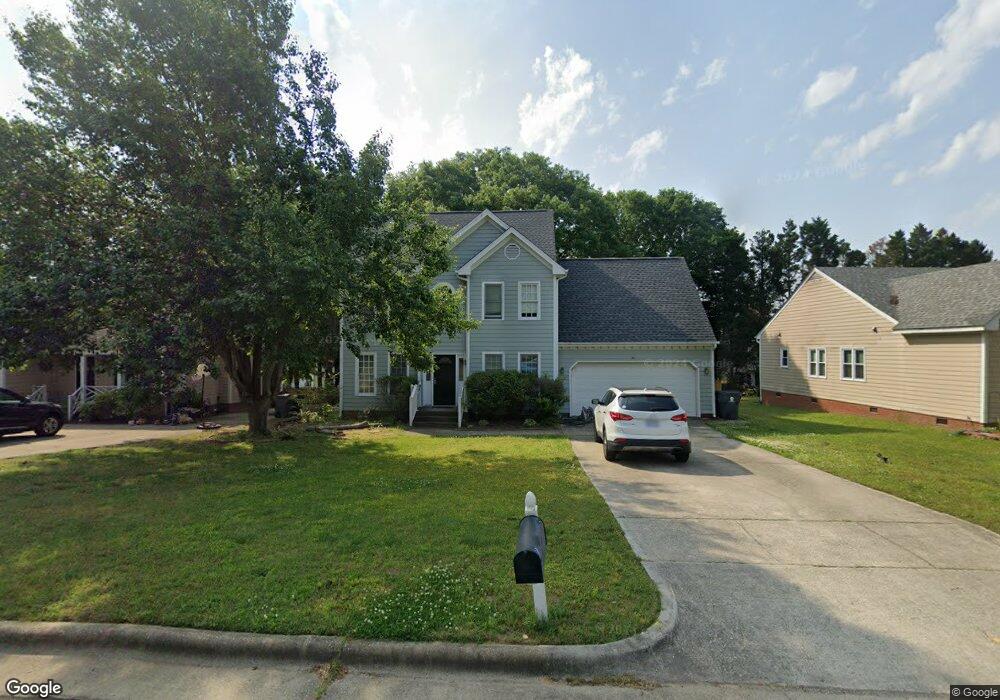
1901 Keokuk Ct Apex, NC 27523
West Cary NeighborhoodEstimated Value: $520,000 - $547,000
3
Beds
3
Baths
1,875
Sq Ft
$284/Sq Ft
Est. Value
About This Home
This home is located at 1901 Keokuk Ct, Apex, NC 27523 and is currently estimated at $532,624, approximately $284 per square foot. 1901 Keokuk Ct is a home located in Wake County with nearby schools including Salem Elementary, Salem Middle, and Green Hope High.
Ownership History
Date
Name
Owned For
Owner Type
Purchase Details
Closed on
Feb 15, 2013
Sold by
Federal Home Loan Mortgage Corporation
Bought by
Lee Hee Suk and Cho Seung Hyun
Current Estimated Value
Home Financials for this Owner
Home Financials are based on the most recent Mortgage that was taken out on this home.
Original Mortgage
$177,620
Interest Rate
3.57%
Mortgage Type
New Conventional
Purchase Details
Closed on
Jun 5, 2012
Sold by
Haecker Tobias and Haecker Sandra E
Bought by
Federal Home Loan Mortgage Corporation
Purchase Details
Closed on
May 16, 2001
Sold by
Worthington Sherry N
Bought by
Haecker Tobias and Haecker Sandra Elsy
Home Financials for this Owner
Home Financials are based on the most recent Mortgage that was taken out on this home.
Original Mortgage
$184,300
Interest Rate
7.12%
Create a Home Valuation Report for This Property
The Home Valuation Report is an in-depth analysis detailing your home's value as well as a comparison with similar homes in the area
Home Values in the Area
Average Home Value in this Area
Purchase History
| Date | Buyer | Sale Price | Title Company |
|---|---|---|---|
| Lee Hee Suk | -- | None Available | |
| Federal Home Loan Mortgage Corporation | $167,480 | None Available | |
| Haecker Tobias | $190,000 | -- |
Source: Public Records
Mortgage History
| Date | Status | Borrower | Loan Amount |
|---|---|---|---|
| Previous Owner | Lee Hee Suk | $177,620 | |
| Previous Owner | Haecker Tobias | $184,300 |
Source: Public Records
Tax History Compared to Growth
Tax History
| Year | Tax Paid | Tax Assessment Tax Assessment Total Assessment is a certain percentage of the fair market value that is determined by local assessors to be the total taxable value of land and additions on the property. | Land | Improvement |
|---|---|---|---|---|
| 2025 | $4,351 | $496,020 | $200,000 | $296,020 |
| 2024 | $4,254 | $496,020 | $200,000 | $296,020 |
| 2023 | $3,630 | $329,111 | $120,000 | $209,111 |
| 2022 | $3,408 | $329,111 | $120,000 | $209,111 |
| 2021 | $3,278 | $329,111 | $120,000 | $209,111 |
| 2020 | $3,245 | $329,111 | $120,000 | $209,111 |
| 2019 | $2,708 | $236,646 | $84,000 | $152,646 |
| 2018 | $2,551 | $236,646 | $84,000 | $152,646 |
| 2017 | $2,375 | $236,646 | $84,000 | $152,646 |
| 2016 | $2,340 | $236,646 | $84,000 | $152,646 |
| 2015 | $2,296 | $226,607 | $74,000 | $152,607 |
| 2014 | $2,214 | $226,607 | $74,000 | $152,607 |
Source: Public Records
Map
Nearby Homes
- 2013 Keokuk Ct
- 700 Oak Ridge Dr
- 721 Oak Ridge Dr
- 708 Oak Ridge Dr
- 705 Oak Ridge Dr
- 720 Oak Ridge Dr
- 712 Oak Ridge Dr
- 709 Oak Ridge Dr
- 2021 Patapsco Dr
- 713 Oak Ridge Dr
- 1808 Beaudet Ln
- 320 Sutton Glen Dr
- 114 Calebra Way
- 106 Daleshire Dr
- 2201 Dial Dr
- 7736 Roberts Rd
- 105 Catchpenny Ct
- 6716 Valley Woods Ln
- 100 Wentbridge Rd
- 552 Rowanwood Way
- 1903 Keokuk Ct
- 1815 Keokuk Ct
- 1907 Castleburg Dr
- 1905 Keokuk Ct
- 1813 Keokuk Ct
- 1909 Castleburg Dr
- 1905 Castleburg Dr
- 1902 Keokuk Ct
- 1911 Castleburg Dr
- 1903 Castleburg Dr
- 1810 Keokuk Ct
- 1907 Keokuk Ct
- 1811 Keokuk Ct
- 1904 Keokuk Ct
- 1913 Castleburg Dr
- 1906 Keokuk Ct
- 1903 Shell Point Way
- 1809 Keokuk Ct
- 1901 Castleburg Dr
- 1915 Castleburg Dr