1901 Lagrange St Toledo, OH 43608
Lagrange NeighborhoodEstimated Value: $22,035 - $248,000
Studio
2
Baths
--
Sq Ft
--
Built
About This Home
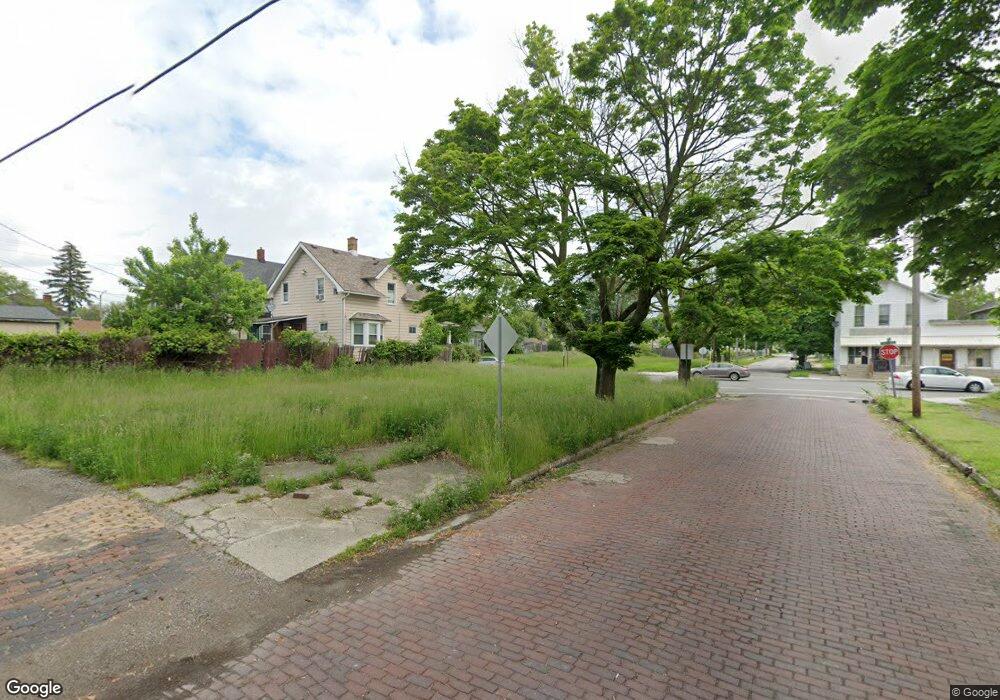
This home is located at 1901 Lagrange St, Toledo, OH 43608 and is currently estimated at $106,259. 1901 Lagrange St is a home located in Lucas County with nearby schools including Sherman Elementary School, Woodward High School, and The Maritime Academy of Toledo.
Ownership History
Date
Name
Owned For
Owner Type
Purchase Details
Closed on
Oct 16, 2009
Sold by
Reca Limited Partnership
Bought by
Ensley Rosalene N
Current Estimated Value
Purchase Details
Closed on
Feb 29, 2008
Sold by
Fannie Mae
Bought by
Reca Lp
Purchase Details
Closed on
Jul 23, 2007
Sold by
Rucker Delton R and Rucker Sherri J
Bought by
Federal National Mortgage Association
Purchase Details
Closed on
Oct 30, 2006
Sold by
Rucker Delton Richard and Rucker Delton R
Bought by
Chase Home Finance Llc
Purchase Details
Closed on
Apr 3, 1998
Sold by
Hanna Christopher L and Hanna Connie R
Bought by
Rucker Delton R
Home Financials for this Owner
Home Financials are based on the most recent Mortgage that was taken out on this home.
Original Mortgage
$20,340
Interest Rate
7.09%
Purchase Details
Closed on
Jul 10, 1996
Sold by
Sutter Ronald J
Bought by
Hanna Christopher L and Hanna Connie R
Create a Home Valuation Report for This Property
The Home Valuation Report is an in-depth analysis detailing your home's value as well as a comparison with similar homes in the area
Home Values in the Area
Average Home Value in this Area
Purchase History
| Date | Buyer | Sale Price | Title Company |
|---|---|---|---|
| Ensley Rosalene N | $10,000 | None Available | |
| Reca Lp | $2,000 | Accutitle Agency Inc | |
| Federal National Mortgage Association | $14,000 | None Available | |
| Chase Home Finance Llc | -- | None Available | |
| Rucker Delton R | $22,600 | -- | |
| Hanna Christopher L | $14,000 | -- |
Source: Public Records
Mortgage History
| Date | Status | Borrower | Loan Amount |
|---|---|---|---|
| Previous Owner | Rucker Delton R | $20,340 |
Source: Public Records
Tax History
| Year | Tax Paid | Tax Assessment Tax Assessment Total Assessment is a certain percentage of the fair market value that is determined by local assessors to be the total taxable value of land and additions on the property. | Land | Improvement |
|---|---|---|---|---|
| 2025 | $44,124 | $2,030 | $2,030 | -- |
| 2024 | $39,274 | $2,030 | $2,030 | -- |
| 2023 | $504 | $1,610 | $1,610 | $0 |
| 2022 | $821 | $1,610 | $1,610 | $0 |
| 2021 | $694 | $1,610 | $1,610 | $0 |
| 2020 | $637 | $1,610 | $1,610 | $0 |
| 2019 | $992 | $1,610 | $1,610 | $0 |
| 2018 | $422 | $1,610 | $1,610 | $0 |
| 2017 | $14,148 | $1,575 | $1,575 | $0 |
| 2016 | $12,184 | $4,500 | $4,500 | $0 |
| 2015 | $431 | $4,500 | $4,500 | $0 |
| 2014 | $153 | $1,580 | $1,580 | $0 |
| 2013 | $102 | $1,580 | $1,580 | $0 |
Source: Public Records
Map
Nearby Homes
- 1907 Lagrange St
- 1909 Lagrange St
- 927 Peck St
- 1817 Lagrange St
- 1913 Lagrange St
- 925 Peck St
- 1815 Lagrange St
- 930 Peck St
- 1915 Lagrange St
- 1813 Lagrange St
- 928 Peck St
- 1902 Lagrange St
- 1820 Lagrange St
- 1906 Lagrange St
- 926 Page St
- 926 Peck St
- 1811 Lagrange St
- 1910 Lagrange St
- 1914 Lagrange St
- 920 Peck St
Your Personal Tour Guide
Ask me questions while you tour the home.