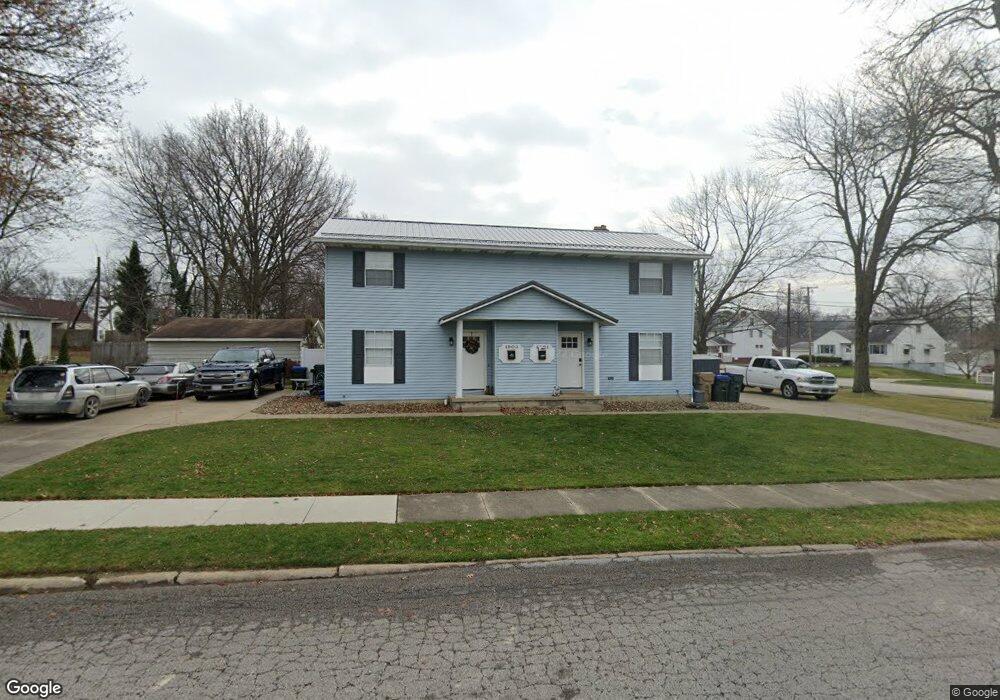
1901 Searl St Unit 1903 Cuyahoga Falls, OH 44221
East Village NeighborhoodEstimated Value: $221,000 - $251,630
4
Beds
2
Baths
1,994
Sq Ft
$121/Sq Ft
Est. Value
About This Home
This home is located at 1901 Searl St Unit 1903, Cuyahoga Falls, OH 44221 and is currently estimated at $242,158, approximately $121 per square foot. 1901 Searl St Unit 1903 is a home located in Summit County with nearby schools including Preston Elementary School, Bolich Middle School, and Cuyahoga Falls High School.
Ownership History
Date
Name
Owned For
Owner Type
Purchase Details
Closed on
May 22, 2020
Sold by
Zimmerman Michael G
Bought by
Chmielewski Tyler M and Gordon Victoria A
Current Estimated Value
Home Financials for this Owner
Home Financials are based on the most recent Mortgage that was taken out on this home.
Original Mortgage
$152,192
Outstanding Balance
$134,863
Interest Rate
3.3%
Mortgage Type
FHA
Estimated Equity
$107,295
Purchase Details
Closed on
Jun 17, 2016
Sold by
Zimmerman Michael G
Bought by
Zimmerman Amy Kathleen
Purchase Details
Closed on
Jul 31, 2001
Sold by
Danison Mervyn F
Bought by
Zimmerman Michael G
Home Financials for this Owner
Home Financials are based on the most recent Mortgage that was taken out on this home.
Original Mortgage
$93,200
Interest Rate
7.5%
Mortgage Type
Seller Take Back
Create a Home Valuation Report for This Property
The Home Valuation Report is an in-depth analysis detailing your home's value as well as a comparison with similar homes in the area
Home Values in the Area
Average Home Value in this Area
Purchase History
| Date | Buyer | Sale Price | Title Company |
|---|---|---|---|
| Chmielewski Tyler M | $155,000 | Clear Title Solutions | |
| Chmielewski Tyler M | $155,000 | Clear Title Solutions | |
| Zimmerman Amy Kathleen | -- | None Available | |
| Zimmerman Michael G | $116,500 | American Certified Title |
Source: Public Records
Mortgage History
| Date | Status | Borrower | Loan Amount |
|---|---|---|---|
| Open | Chmielewski Tyler M | $152,192 | |
| Closed | Chmielewski Tyler M | $152,192 | |
| Previous Owner | Zimmerman Michael G | $93,200 |
Source: Public Records
Tax History Compared to Growth
Tax History
| Year | Tax Paid | Tax Assessment Tax Assessment Total Assessment is a certain percentage of the fair market value that is determined by local assessors to be the total taxable value of land and additions on the property. | Land | Improvement |
|---|---|---|---|---|
| 2025 | $3,822 | $70,102 | $8,873 | $61,229 |
| 2024 | $3,822 | $70,102 | $8,873 | $61,229 |
| 2023 | $3,822 | $70,102 | $8,873 | $61,229 |
| 2022 | $3,619 | $53,925 | $6,825 | $47,100 |
| 2021 | $3,619 | $53,925 | $6,825 | $47,100 |
| 2020 | $3,339 | $49,950 | $6,830 | $43,120 |
| 2019 | $3,672 | $48,680 | $6,350 | $42,330 |
| 2018 | $3,145 | $48,680 | $6,350 | $42,330 |
| 2017 | $3,011 | $48,680 | $6,350 | $42,330 |
| 2016 | $3,063 | $48,680 | $6,350 | $42,330 |
| 2015 | $3,011 | $48,680 | $6,350 | $42,330 |
| 2014 | $3,013 | $48,680 | $6,350 | $42,330 |
| 2013 | $3,084 | $50,270 | $6,350 | $43,920 |
Source: Public Records
Map
Nearby Homes
- 616 Tallmadge Rd
- 562 Tallmadge Rd
- 1686 Underwood St
- 1944 High St
- 2020 Deming St
- 955 Davis Ave
- 806 Curtis Ave
- 1512 Bancroft St
- 721 Myrtle Ave
- 425 Myrtle Ave
- 965 Elizabeth Ct
- 1846 Front St Unit 402
- 1734 Front St Unit 34
- 1734 Front St Unit 37
- 1734 Front St Unit 36
- 1734 Front St Unit 35
- 1921 Dwight St
- 116 Munroe Falls Ave
- 1757 3rd St
- 1512 Treasch Dr
- 613 Tallmadge Rd
- 615 Tallmadge Rd
- 617 Tallmadge Rd
- 1905 Searl St
- 1907 Searl St
- 639 Tallmadge Rd
- 1909 Searl St
- 626 Stuart Ave
- 620 Tallmadge Rd
- 622 Stuart Ave
- 624 Tallmadge Rd
- 612 Tallmadge Rd
- 634 Stuart Ave
- 606 Tallmadge Rd
- 638 Stuart Ave
- 642 Stuart Ave
- 600 Tallmadge Rd
- 647 Tallmadge Rd
- 646 Stuart Ave
- 636 Tallmadge Rd