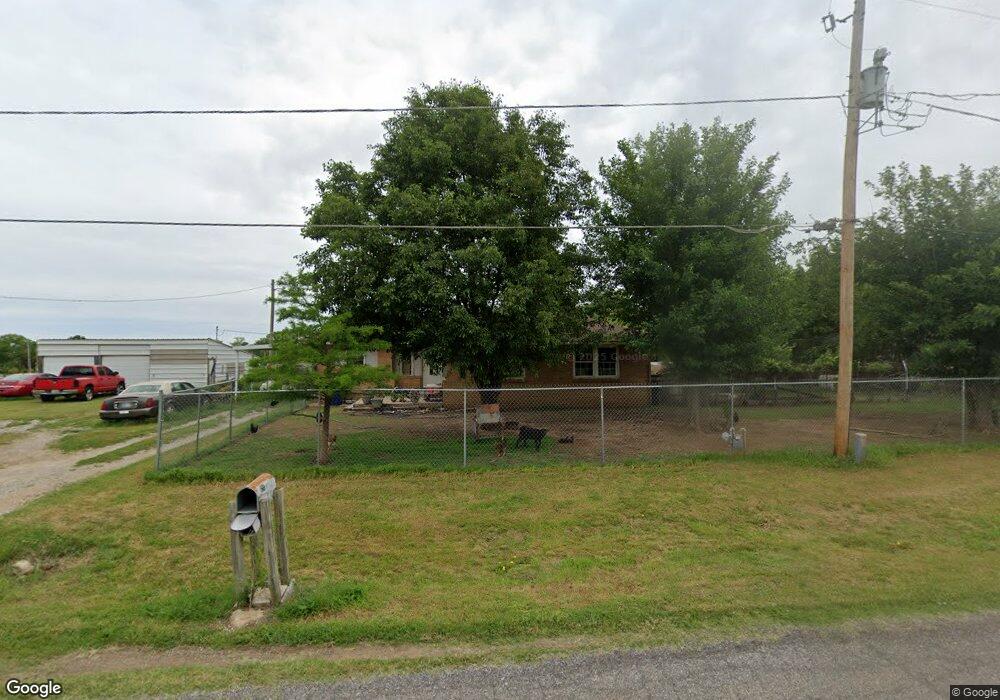
1901 Travis Rd El Reno, OK 73036
Estimated Value: $163,000 - $253,000
3
Beds
2
Baths
1,710
Sq Ft
$117/Sq Ft
Est. Value
About This Home
This home is located at 1901 Travis Rd, El Reno, OK 73036 and is currently estimated at $199,897, approximately $116 per square foot. 1901 Travis Rd is a home located in Canadian County with nearby schools including Hillcrest Elementary School, Rose Witcher Elementary School, and Lincoln Learning Center.
Ownership History
Date
Name
Owned For
Owner Type
Purchase Details
Closed on
Sep 3, 2008
Sold by
Peters Wilfred F and Peters Zelma M
Bought by
Peters Orval F and Peters Salena J
Current Estimated Value
Purchase Details
Closed on
Oct 12, 2007
Sold by
Peters Orval F
Bought by
Richards Paul W and Richards Gina A
Home Financials for this Owner
Home Financials are based on the most recent Mortgage that was taken out on this home.
Original Mortgage
$97,739
Interest Rate
6.48%
Mortgage Type
New Conventional
Purchase Details
Closed on
Sep 2, 2005
Sold by
Peters Wilfred F and Peters Zelma M
Bought by
Peters Orval F and Peters Salena J
Home Financials for this Owner
Home Financials are based on the most recent Mortgage that was taken out on this home.
Original Mortgage
$78,500
Interest Rate
3%
Mortgage Type
Purchase Money Mortgage
Purchase Details
Closed on
Jun 26, 1996
Sold by
Peters Wilfred F and Peters Zelma
Purchase Details
Closed on
May 27, 1988
Purchase Details
Closed on
Mar 16, 1988
Create a Home Valuation Report for This Property
The Home Valuation Report is an in-depth analysis detailing your home's value as well as a comparison with similar homes in the area
Home Values in the Area
Average Home Value in this Area
Purchase History
| Date | Buyer | Sale Price | Title Company |
|---|---|---|---|
| Peters Orval F | -- | None Available | |
| Richards Paul W | $742,500 | None Available | |
| Peters Orval F | $58,875 | None Available | |
| -- | $50,000 | -- | |
| -- | -- | -- | |
| -- | -- | -- |
Source: Public Records
Mortgage History
| Date | Status | Borrower | Loan Amount |
|---|---|---|---|
| Previous Owner | Richards Paul W | $97,739 | |
| Previous Owner | Peters Orval F | $78,500 |
Source: Public Records
Tax History Compared to Growth
Tax History
| Year | Tax Paid | Tax Assessment Tax Assessment Total Assessment is a certain percentage of the fair market value that is determined by local assessors to be the total taxable value of land and additions on the property. | Land | Improvement |
|---|---|---|---|---|
| 2024 | $1,457 | $15,038 | $2,700 | $12,338 |
| 2023 | $1,457 | $14,600 | $2,700 | $11,900 |
| 2022 | $1,417 | $14,175 | $2,700 | $11,475 |
| 2021 | $1,411 | $13,808 | $2,700 | $11,108 |
| 2020 | $1,350 | $13,406 | $2,700 | $10,706 |
| 2019 | $1,365 | $13,015 | $2,700 | $10,315 |
| 2018 | $1,309 | $12,636 | $2,700 | $9,936 |
| 2017 | $1,293 | $12,268 | $2,700 | $9,568 |
| 2016 | $1,261 | $12,268 | $2,700 | $9,568 |
| 2015 | $1,163 | $11,564 | $2,700 | $8,864 |
| 2014 | $1,163 | $11,227 | $2,700 | $8,527 |
Source: Public Records
Map
Nearby Homes
- 1601 S Shepard Ave
- 1621 Chuck Wagon Dr
- 1608 Chuck Wagon Dr
- 1607 Chuck Wagon Dr
- 1101 Gabriel St
- 1117 SW Heritage Dr
- 1219 Heritage Dr
- 1207 Heritage Dr
- 1645 E Us Highway 66
- 1646 U S Route 66
- 313 Hal Dr
- 811 S Hoff Ave
- 819 S Macomb Ave
- 1118 S Barker Ave
- 0 Borders On 66hwy & Alfadale Rd's
- 811 S Barker Ave
- 1008 E Woodson St
- 100 N Donald Ave
- 106 Slant St
- 900 E Woodson St
- 1903 Travis Rd
- 1903 Travis Rd
- 1902 Travis Rd
- 1820 Travis Rd
- 1905 Travis Rd
- 1905 Travis Dr
- 1904 Travis Rd
- 1904 Travis Dr
- 1907 Travis Rd
- 1776 Travis Rd
- 1908 Travis Rd
- 1909 Travis Rd
- 1910 Travis Rd
- 1910 Travis Rd Unit 5-9
- 1901 Cheryl Dr
- 1903 Cheryl Dr
- 1911 Travis Rd
- 1905 Cheryl Dr
- 1825 Cheryl Dr
- 1821 Cheryl Dr