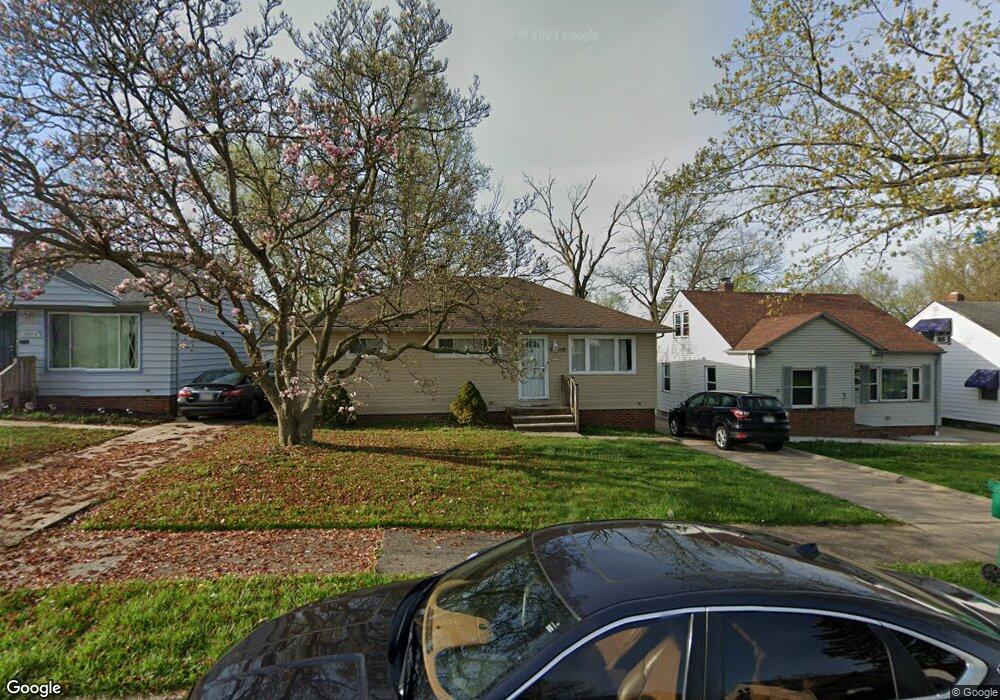
19010 Longview Ave Maple Heights, OH 44137
Estimated Value: $111,000 - $135,000
3
Beds
2
Baths
1,004
Sq Ft
$119/Sq Ft
Est. Value
About This Home
This home is located at 19010 Longview Ave, Maple Heights, OH 44137 and is currently estimated at $119,158, approximately $118 per square foot. 19010 Longview Ave is a home located in Cuyahoga County with nearby schools including Abraham Lincoln Elementary School, Rockside/ J.F. Kennedy School, and Barack Obama School.
Ownership History
Date
Name
Owned For
Owner Type
Purchase Details
Closed on
Jul 14, 2025
Sold by
Mnd Investments And Property Preservatio
Bought by
Vaughn Desiree
Current Estimated Value
Purchase Details
Closed on
Apr 1, 2019
Sold by
Ardent Real Estate Investments Llc
Bought by
Mnd Investments & Prop Preservation Llc
Purchase Details
Closed on
Jul 15, 2013
Sold by
Smith Kevin and Smith Pamela
Bought by
Ardent Real Estate Investments Llc
Purchase Details
Closed on
Oct 31, 1995
Sold by
Hirko John E
Bought by
Smith Kevin L and Smith Pamela
Home Financials for this Owner
Home Financials are based on the most recent Mortgage that was taken out on this home.
Original Mortgage
$74,891
Interest Rate
7.65%
Mortgage Type
FHA
Purchase Details
Closed on
Mar 25, 1985
Sold by
Hirko John E and B S
Bought by
Hirko John E
Purchase Details
Closed on
Jan 1, 1975
Bought by
Hirko John E and B S
Create a Home Valuation Report for This Property
The Home Valuation Report is an in-depth analysis detailing your home's value as well as a comparison with similar homes in the area
Home Values in the Area
Average Home Value in this Area
Purchase History
| Date | Buyer | Sale Price | Title Company |
|---|---|---|---|
| Vaughn Desiree | -- | None Listed On Document | |
| Mnd Investments & Prop Preservation Llc | $45,500 | None Available | |
| Ardent Real Estate Investments Llc | $47,100 | Attorney | |
| Smith Kevin L | $75,000 | -- | |
| Hirko John E | -- | -- | |
| Hirko John E | -- | -- |
Source: Public Records
Mortgage History
| Date | Status | Borrower | Loan Amount |
|---|---|---|---|
| Previous Owner | Smith Kevin L | $74,891 |
Source: Public Records
Tax History
| Year | Tax Paid | Tax Assessment Tax Assessment Total Assessment is a certain percentage of the fair market value that is determined by local assessors to be the total taxable value of land and additions on the property. | Land | Improvement |
|---|---|---|---|---|
| 2024 | $3,436 | $37,030 | $7,560 | $29,470 |
| 2023 | $2,347 | $21,040 | $4,590 | $16,450 |
| 2022 | $2,339 | $21,035 | $4,585 | $16,450 |
| 2021 | $2,492 | $21,040 | $4,590 | $16,450 |
| 2020 | $2,134 | $15,930 | $3,470 | $12,460 |
| 2019 | $2,121 | $45,500 | $9,900 | $35,600 |
| 2018 | $2,002 | $15,930 | $3,470 | $12,460 |
| 2017 | $2,048 | $15,020 | $3,220 | $11,800 |
| 2016 | $1,980 | $15,020 | $3,220 | $11,800 |
| 2015 | $4,334 | $15,020 | $3,220 | $11,800 |
| 2014 | $4,334 | $16,490 | $3,540 | $12,950 |
Source: Public Records
Map
Nearby Homes
- 18990 Raymond St
- 18851 Raymond St
- 18704 Longview Ave
- 5194 Homewood Ave
- 5165 Camden Rd
- 5100 Erwin St
- 18715 Libby Rd
- 19520 Maple Heights Blvd
- 5219 Joseph St
- 5150 Arch St
- 19931 Raymond St
- 5239 Arch St
- 5031 Cato St
- 5177 Cato St
- 18909 Maple Heights Blvd
- 5357 Beechwood Ave
- 19289 Stafford Ave
- 17914 Libby Rd
- 5409 Hollywood Ave
- 5082 Philip Ave
- 19006 Longview Ave
- 19014 Longview Ave
- 19002 Longview Ave
- 19018 Longview Ave
- 19001 Raymond St
- 19021 Raymond St
- 18981 Raymond St
- 18918 Longview Ave
- 19041 Raymond St
- 18961 Raymond St
- 19102 Longview Ave
- 19061 Raymond St
- 19007 Longview Ave
- 19011 Longview Ave
- 18951 Raymond St
- 19003 Longview Ave
- 19015 Longview Ave
- 18914 Longview Ave
- 18919 Longview Ave
- 19081 Raymond St
Your Personal Tour Guide
Ask me questions while you tour the home.