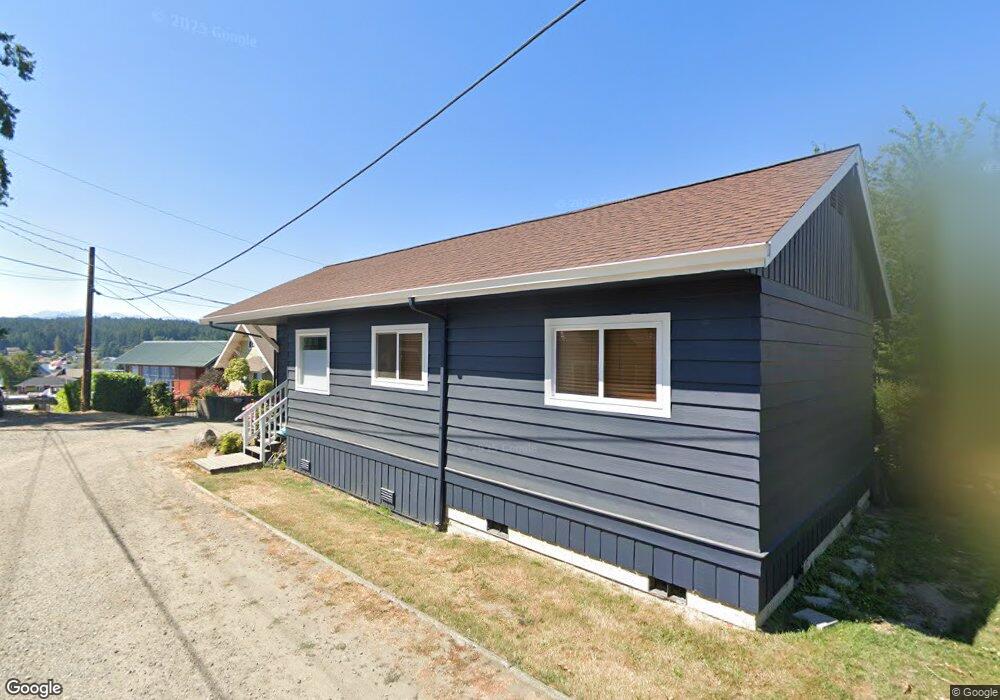
19013 4th Ave NE Poulsbo, WA 98370
Estimated Value: $493,516 - $569,000
2
Beds
1
Bath
1,208
Sq Ft
$433/Sq Ft
Est. Value
About This Home
This home is located at 19013 4th Ave NE, Poulsbo, WA 98370 and is currently estimated at $522,629, approximately $432 per square foot. 19013 4th Ave NE is a home located in Kitsap County with nearby schools including Poulsbo Elementary School, Poulsbo Middle School, and North Kitsap High School.
Ownership History
Date
Name
Owned For
Owner Type
Purchase Details
Closed on
Feb 14, 2018
Sold by
Michael Lunn
Bought by
Smith Angie and Smith Daniel
Current Estimated Value
Home Financials for this Owner
Home Financials are based on the most recent Mortgage that was taken out on this home.
Original Mortgage
$267,750
Outstanding Balance
$228,610
Interest Rate
4.32%
Estimated Equity
$294,019
Purchase Details
Closed on
Oct 31, 2017
Sold by
Lunn Michael
Bought by
Smith Angie L and Smith Daniel A
Home Financials for this Owner
Home Financials are based on the most recent Mortgage that was taken out on this home.
Original Mortgage
$267,750
Interest Rate
3.94%
Purchase Details
Closed on
Apr 1, 2010
Sold by
Gauthier Raymond M
Bought by
Lunn Michael
Purchase Details
Closed on
Aug 18, 2000
Sold by
Hooper Douglas V and Hooper Joan
Bought by
Gauthier Raymond M
Purchase Details
Closed on
Jul 8, 1995
Sold by
Hooper Douglas V
Bought by
Hooper Joan A
Create a Home Valuation Report for This Property
The Home Valuation Report is an in-depth analysis detailing your home's value as well as a comparison with similar homes in the area
Home Values in the Area
Average Home Value in this Area
Purchase History
| Date | Buyer | Sale Price | Title Company |
|---|---|---|---|
| Smith Angie | -- | -- | |
| Smith Angie L | $561,200 | -- | |
| Lunn Michael | $132,066 | Pacific Nw Title | |
| Gauthier Raymond M | -- | -- | |
| Hooper Joan A | -- | -- |
Source: Public Records
Mortgage History
| Date | Status | Borrower | Loan Amount |
|---|---|---|---|
| Open | Smith Angie | $267,750 | |
| Closed | Smith Angie | -- | |
| Previous Owner | Smith Angie L | $267,750 | |
| Previous Owner | Smith Angie L | -- |
Source: Public Records
Tax History Compared to Growth
Tax History
| Year | Tax Paid | Tax Assessment Tax Assessment Total Assessment is a certain percentage of the fair market value that is determined by local assessors to be the total taxable value of land and additions on the property. | Land | Improvement |
|---|---|---|---|---|
| 2026 | $3,660 | $407,800 | $151,640 | $256,160 |
| 2025 | $3,660 | $407,800 | $151,640 | $256,160 |
| 2024 | $3,055 | $350,480 | $132,650 | $217,830 |
| 2023 | $3,107 | $350,480 | $132,650 | $217,830 |
| 2022 | $2,772 | $297,340 | $115,150 | $182,190 |
| 2021 | $2,682 | $266,550 | $103,170 | $163,380 |
| 2020 | $2,611 | $255,010 | $98,570 | $156,440 |
| 2019 | $2,444 | $238,660 | $92,120 | $146,540 |
| 2018 | $2,126 | $176,550 | $67,440 | $109,110 |
| 2017 | $2,030 | $176,550 | $67,440 | $109,110 |
| 2016 | $2,139 | $171,350 | $70,080 | $101,270 |
| 2015 | $2,083 | $167,780 | $70,080 | $97,700 |
| 2014 | -- | $162,790 | $70,080 | $92,710 |
| 2013 | -- | $162,790 | $70,080 | $92,710 |
Source: Public Records
Map
Nearby Homes
- 17602 NE Midnight Sun Loop
- 0 7th Ave NE Unit NWM2280996
- 123 NE Whimbrel Ln
- 600 NE Lincoln Rd Unit 41
- 493 NE Lincoln Rd
- 19463 Scoter Ln NE
- 18785 Ness Place NE
- 32 NE Sunset St
- 19554 Jensen Way NE
- 18637 Fjord Dr NE
- 19531 Front St NE
- 20249 State Highway 305 NE
- 19795 4th Ave NE
- 19809 Ash Crest Loop NE
- 18330 9th Ave NE
- 20050 Vikings Crest Loop NE Unit 2-301
- 20065 Regin Ct NE
- 20145 Vikings Crest Loop NE Unit 3-204
- 19301 Viking Ave NW
- 21601 Viking Ave NW
- 19017 4th Ave NE
- 19033 4th Ave NE
- 19005 4th Ave NE
- 19063 4th Ave NE
- 19022 3rd Ave NE
- 18973 4th Ave NE
- 19042 3rd Ave NE
- 19071 4th Ave NE
- 18970 3rd Ave NE
- 418 Viewmont St NE
- 19068 3rd Ave NE
- 18968 4th Ave NE
- 18945 4th Ave NE
- 18941 4th Ave NE
- 19093 4th Ave NE
- 19104 3rd Ave NE
- 442 Viewmont St NE
- 18951 3rd Ave NE
- 19110 4th Ave NE