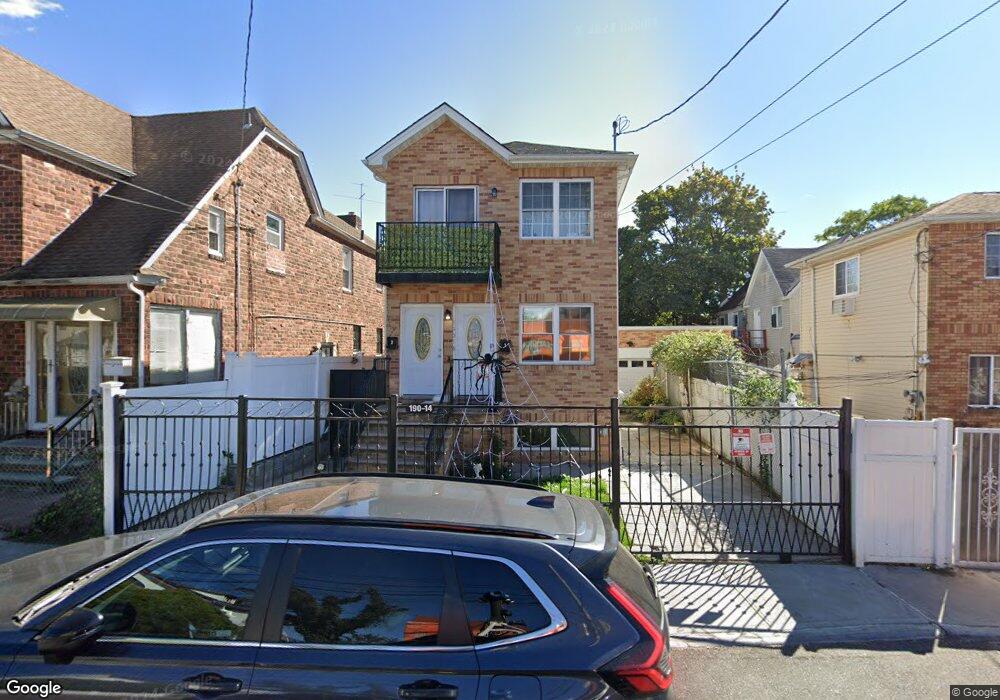
19014 109th Rd St. Albans, NY 11412
Hollis NeighborhoodEstimated Value: $849,000 - $970,000
4
Beds
3
Baths
1,658
Sq Ft
$555/Sq Ft
Est. Value
About This Home
This home is located at 19014 109th Rd, St. Albans, NY 11412 and is currently estimated at $920,593, approximately $555 per square foot. 19014 109th Rd is a home located in Queens County with nearby schools including P.S. 118 Lorraine Hansberry, I.S. 192 The Linden, and Wellspring Elementary & Middle.
Ownership History
Date
Name
Owned For
Owner Type
Purchase Details
Closed on
Sep 21, 2021
Sold by
Polanco Jose A
Bought by
Bueno Evelyn and Nunez Christine
Current Estimated Value
Home Financials for this Owner
Home Financials are based on the most recent Mortgage that was taken out on this home.
Original Mortgage
$813,984
Outstanding Balance
$740,665
Interest Rate
2.8%
Mortgage Type
Purchase Money Mortgage
Estimated Equity
$179,928
Purchase Details
Closed on
Apr 28, 2020
Sold by
5 Stanley Lane Corp
Bought by
Polanco Jose A
Purchase Details
Closed on
Dec 7, 2018
Sold by
5 Stanley Lane Corp
Bought by
5 Stanley Lane Corp
Create a Home Valuation Report for This Property
The Home Valuation Report is an in-depth analysis detailing your home's value as well as a comparison with similar homes in the area
Home Values in the Area
Average Home Value in this Area
Purchase History
| Date | Buyer | Sale Price | Title Company |
|---|---|---|---|
| Bueno Evelyn | $829,000 | -- | |
| Polanco Jose A | -- | -- | |
| 5 Stanley Lane Corp | -- | -- |
Source: Public Records
Mortgage History
| Date | Status | Borrower | Loan Amount |
|---|---|---|---|
| Open | Bueno Evelyn | $813,984 |
Source: Public Records
Tax History Compared to Growth
Tax History
| Year | Tax Paid | Tax Assessment Tax Assessment Total Assessment is a certain percentage of the fair market value that is determined by local assessors to be the total taxable value of land and additions on the property. | Land | Improvement |
|---|---|---|---|---|
| 2025 | $6,977 | $34,739 | $11,373 | $23,366 |
| 2024 | $6,977 | $34,739 | $12,474 | $22,265 |
| 2023 | $6,977 | $34,739 | $13,886 | $20,853 |
| 2022 | $6,564 | $43,260 | $17,580 | $25,680 |
| 2021 | $6,529 | $40,860 | $17,580 | $23,280 |
| 2020 | $5,616 | $37,980 | $17,580 | $20,400 |
| 2019 | $1,214 | $13,020 | $13,020 | $20,400 |
| 2018 | $1,116 | $5,473 | $3,755 | $1,718 |
| 2017 | $1,106 | $5,428 | $3,978 | $1,450 |
| 2016 | $1,024 | $5,428 | $3,978 | $1,450 |
| 2015 | $618 | $4,833 | $3,907 | $926 |
| 2014 | $618 | $4,561 | $3,688 | $873 |
Source: Public Records
Map
Nearby Homes
- 10533 Farmers Blvd
- 19027 109th Rd
- 111-06 Farmers Blvd
- 10532 192nd St
- 187-23 Brinkerhoff Ave
- 193-21 109th Rd
- 19022 111th Rd
- 187-44 Jordan Ave
- 19319 109th Rd
- 19404 110th Rd
- 186-16 Hilburn Ave
- 188-25 Mangin Ave
- 104-40 194th St
- 18823 Mangin Ave
- 190-59 112th Ave
- 18833 Keeseville Ave
- 190-63 112th Ave
- 188-07 Mangin Ave
- 194-10 Hollis Ave
- 190-30 103rd Ave
- 190-14 109th Rd Unit 2nd Fl
- 190-14 109th Rd
- 19014 109th Rd
- 19016 109th Rd
- 19008 109th Rd
- 190-08 109th Rd
- 10931 Farmers Blvd
- 10916 190th Place
- 10933 Farmers Blvd
- 10929 Farmers Blvd
- 109-29 Farmers Blvd
- 10925 Farmers Blvd
- 109-25 Farmers Blvd
- 19005 109th Rd Unit 2
- 10935 Farmers Blvd
- 10924 190th Place
- 10919 Farmers Blvd
- 109-33 Farmers Blvd
- 10917 Farmers Blvd
- 109-19 Farmers Blvd