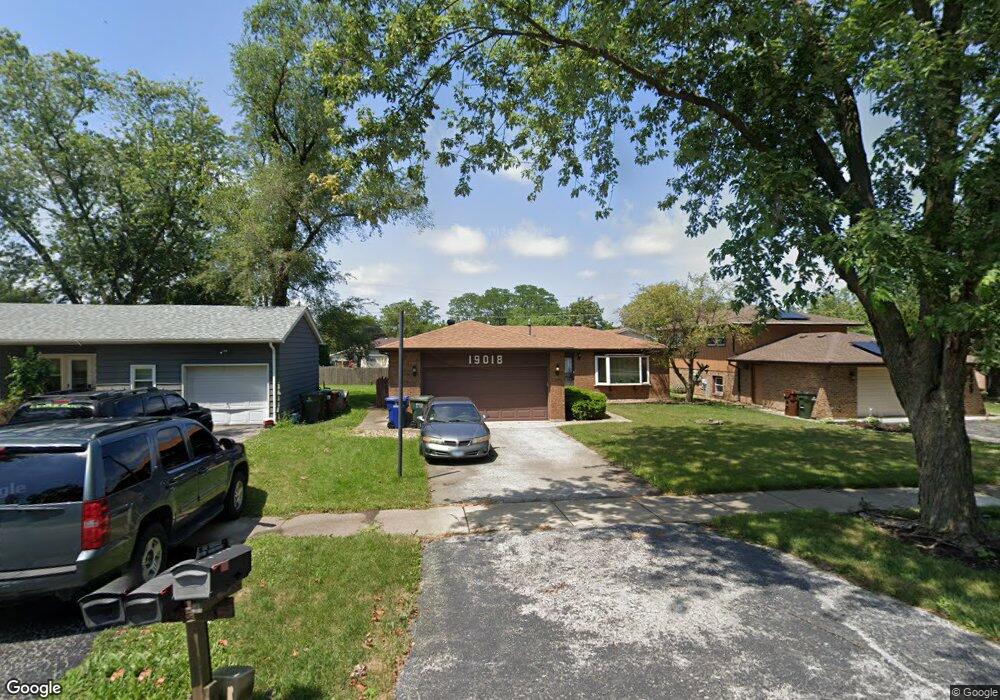
19018 Springfield Ave Flossmoor, IL 60422
Estimated Value: $190,000 - $249,000
3
Beds
1
Bath
1,163
Sq Ft
$183/Sq Ft
Est. Value
About This Home
This home is located at 19018 Springfield Ave, Flossmoor, IL 60422 and is currently estimated at $213,049, approximately $183 per square foot. 19018 Springfield Ave is a home located in Cook County with nearby schools including Flossmoor Hills Elementary School, Parker Junior High School, and Homewood-Flossmoor High School.
Ownership History
Date
Name
Owned For
Owner Type
Purchase Details
Closed on
Nov 9, 2021
Sold by
Frison Conchita L
Bought by
Frison Conchita L and Conchita L Frison Living Trust
Current Estimated Value
Purchase Details
Closed on
May 12, 2006
Sold by
Hampton Bill D
Bought by
Frison John W and Frison Conchita L
Home Financials for this Owner
Home Financials are based on the most recent Mortgage that was taken out on this home.
Original Mortgage
$122,400
Outstanding Balance
$72,601
Interest Rate
7.12%
Mortgage Type
Purchase Money Mortgage
Estimated Equity
$140,448
Purchase Details
Closed on
May 22, 2003
Sold by
Adams Edwards E and Adams Celeste
Bought by
Hampton Bill D
Home Financials for this Owner
Home Financials are based on the most recent Mortgage that was taken out on this home.
Original Mortgage
$112,100
Interest Rate
4.25%
Mortgage Type
Unknown
Create a Home Valuation Report for This Property
The Home Valuation Report is an in-depth analysis detailing your home's value as well as a comparison with similar homes in the area
Home Values in the Area
Average Home Value in this Area
Purchase History
| Date | Buyer | Sale Price | Title Company |
|---|---|---|---|
| Frison Conchita L | -- | Accommodation | |
| Frison John W | $175,000 | Cti | |
| Hampton Bill D | $118,000 | Multiple |
Source: Public Records
Mortgage History
| Date | Status | Borrower | Loan Amount |
|---|---|---|---|
| Open | Frison John W | $122,400 | |
| Previous Owner | Hampton Bill D | $112,100 |
Source: Public Records
Tax History
| Year | Tax Paid | Tax Assessment Tax Assessment Total Assessment is a certain percentage of the fair market value that is determined by local assessors to be the total taxable value of land and additions on the property. | Land | Improvement |
|---|---|---|---|---|
| 2025 | $1,972 | $16,001 | $2,993 | $13,008 |
| 2024 | $1,972 | $16,001 | $2,993 | $13,008 |
| 2023 | $2,571 | $16,001 | $2,993 | $13,008 |
| 2022 | $2,571 | $12,488 | $2,594 | $9,894 |
| 2021 | $2,508 | $12,487 | $2,593 | $9,894 |
| 2020 | $2,238 | $12,487 | $2,593 | $9,894 |
| 2019 | $2,583 | $12,115 | $2,394 | $9,721 |
| 2018 | $2,490 | $12,115 | $2,394 | $9,721 |
| 2017 | $2,402 | $12,115 | $2,394 | $9,721 |
| 2016 | $3,774 | $11,982 | $2,194 | $9,788 |
| 2015 | $3,983 | $11,982 | $2,194 | $9,788 |
| 2014 | $2,999 | $11,982 | $2,194 | $9,788 |
| 2013 | $3,837 | $12,539 | $2,194 | $10,345 |
Source: Public Records
Map
Nearby Homes
- 19002 Springfield Ave
- 3746 Cherry Hills Dr
- 18900 Oakwood Ct
- 18941 Cypress Ave Unit 2
- 835 Maple Rd
- 18961 Keeler Ave
- 4141 191st Ct Unit 79
- 19211 Elm Dr Unit 145
- 3712 Beech St
- 4008 192nd Place
- 800 Elm St
- 19221 Elm Dr Unit 150
- 4000 193rd St Unit 1B
- 1034 Central Park Ave
- 4128 192nd Ct Unit 221
- 19129 Pine Dr Unit 113
- 19135 Pine Dr Unit 2
- 4041 187th Place
- 3641 Beech St
- 19128 Pine Dr Unit 120
- 19020 Springfield Ave
- 19020 Springfield Ave
- 19020 Springfield Ave
- 19008 Springfield Ave
- 19019 Harding Ave
- 19028 Springfield Ave
- 19028 Springfield Ave
- 19015 Springfield Ave
- 19001 Harding Ave
- 19001 Harding Ave
- 19027 Harding Ave
- 19013 Springfield Ave
- 19025 Springfield Ave
- 19007 Springfield Ave
- 19031 Harding Ave
- 18940 Springfield Ave
- 18940 Springfield Ave
- 19033 Springfield Ave
- 3934 190th St
Your Personal Tour Guide
Ask me questions while you tour the home.