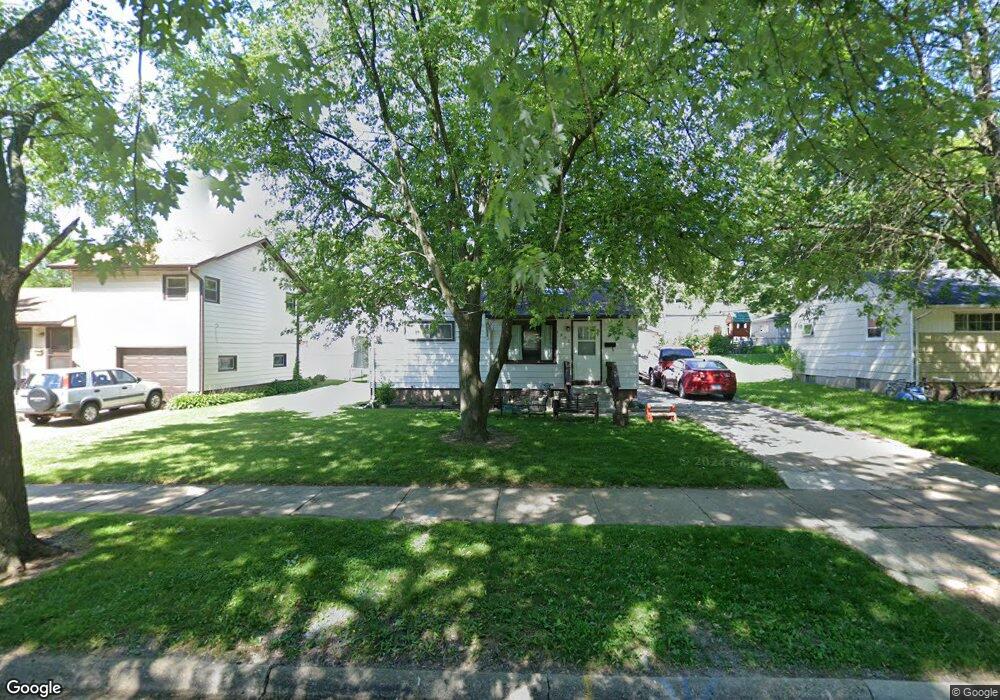
1902 Chippewa Rd Waukegan, IL 60087
Lake Cogardens NeighborhoodEstimated Value: $196,000 - $219,000
2
Beds
1
Bath
768
Sq Ft
$268/Sq Ft
Est. Value
About This Home
This home is located at 1902 Chippewa Rd, Waukegan, IL 60087 and is currently estimated at $206,193, approximately $268 per square foot. 1902 Chippewa Rd is a home located in Lake County with nearby schools including Clearview Elementary School, Miguel Juarez Middle School, and Waukegan High School.
Ownership History
Date
Name
Owned For
Owner Type
Purchase Details
Closed on
Aug 8, 2006
Sold by
Kristan Edward R
Bought by
Solis Mayra S and Ruiz Carlos
Current Estimated Value
Home Financials for this Owner
Home Financials are based on the most recent Mortgage that was taken out on this home.
Original Mortgage
$141,400
Outstanding Balance
$85,446
Interest Rate
6.88%
Mortgage Type
Purchase Money Mortgage
Estimated Equity
$120,747
Purchase Details
Closed on
Aug 2, 2006
Sold by
Deutsche Bank National Trust Co
Bought by
Kristan Edward R
Home Financials for this Owner
Home Financials are based on the most recent Mortgage that was taken out on this home.
Original Mortgage
$141,400
Outstanding Balance
$85,446
Interest Rate
6.88%
Mortgage Type
Purchase Money Mortgage
Estimated Equity
$120,747
Purchase Details
Closed on
Feb 28, 1996
Sold by
Va
Bought by
Bankers Trust Company Of California Na and Vendee Mtg Trust 1996-1
Purchase Details
Closed on
May 24, 1995
Sold by
Grinnell Clinton O
Bought by
Va
Create a Home Valuation Report for This Property
The Home Valuation Report is an in-depth analysis detailing your home's value as well as a comparison with similar homes in the area
Home Values in the Area
Average Home Value in this Area
Purchase History
| Date | Buyer | Sale Price | Title Company |
|---|---|---|---|
| Solis Mayra S | $141,500 | First American Title Ins Co | |
| Kristan Edward R | -- | First American Title | |
| Bankers Trust Company Of California Na | -- | -- | |
| Va | -- | Wheatland Title Guaranty Co |
Source: Public Records
Mortgage History
| Date | Status | Borrower | Loan Amount |
|---|---|---|---|
| Open | Solis Mayra S | $141,400 |
Source: Public Records
Tax History Compared to Growth
Tax History
| Year | Tax Paid | Tax Assessment Tax Assessment Total Assessment is a certain percentage of the fair market value that is determined by local assessors to be the total taxable value of land and additions on the property. | Land | Improvement |
|---|---|---|---|---|
| 2024 | $4,921 | $57,763 | $8,597 | $49,166 |
| 2023 | $4,921 | $52,184 | $7,768 | $44,416 |
| 2022 | $4,236 | $43,330 | $7,402 | $35,928 |
| 2021 | $3,948 | $37,872 | $6,407 | $31,465 |
| 2020 | $3,999 | $35,282 | $5,969 | $29,313 |
| 2019 | $4,025 | $32,331 | $5,470 | $26,861 |
| 2018 | $3,362 | $26,000 | $6,967 | $19,033 |
| 2017 | $3,272 | $23,003 | $6,164 | $16,839 |
| 2016 | $3,089 | $19,988 | $5,356 | $14,632 |
| 2015 | $3,022 | $17,890 | $4,794 | $13,096 |
| 2014 | $3,267 | $19,308 | $5,262 | $14,046 |
| 2012 | $4,048 | $20,918 | $5,701 | $15,217 |
Source: Public Records
Map
Nearby Homes
- 2440 W Cheyenne Rd
- 1913 Chippewa Rd
- 2207 Williamsburg Dr
- 2715 W Greenwood Ave
- 12352 W Atlantic Ave
- 2008 Harding Ave
- 2009 Harding Ave
- 2810 W Atlantic Ave
- 2928 W Country Club Ave
- 3000 W Country Club Ave
- 2946 W Country Club Ave
- 2713 Varonen Ave
- 2813 Theresa Ave
- 2705 Dana Ave
- 3320 Sunset Ave
- 2350 N Lewis Ave
- 2708 Dana Ave
- 1038 Indiana Ave
- 1023 N Elmwood Ave
- 1005 N Lewis Ave
- 1908 Chippewa Rd
- 1858 Chippewa Rd
- 1901 Apache Rd
- 1907 Apache Rd Unit 1
- 1859 Apache Rd
- 1914 Chippewa Rd
- 1913 Apache Rd
- 1901 Chippewa Rd
- 2450 W Cheyenne Rd
- 1857 Chippewa Rd
- 1907 Chippewa Rd
- 1920 Chippewa Rd
- 2410 W Cheyenne Rd
- 1921 Apache Rd
- 1908 Apache Rd
- 1926 Chippewa Rd
- 2341 Commanche Ct
- 1858 Apache Rd
- 2350 W Cheyenne Rd
- 1927 Apache Rd