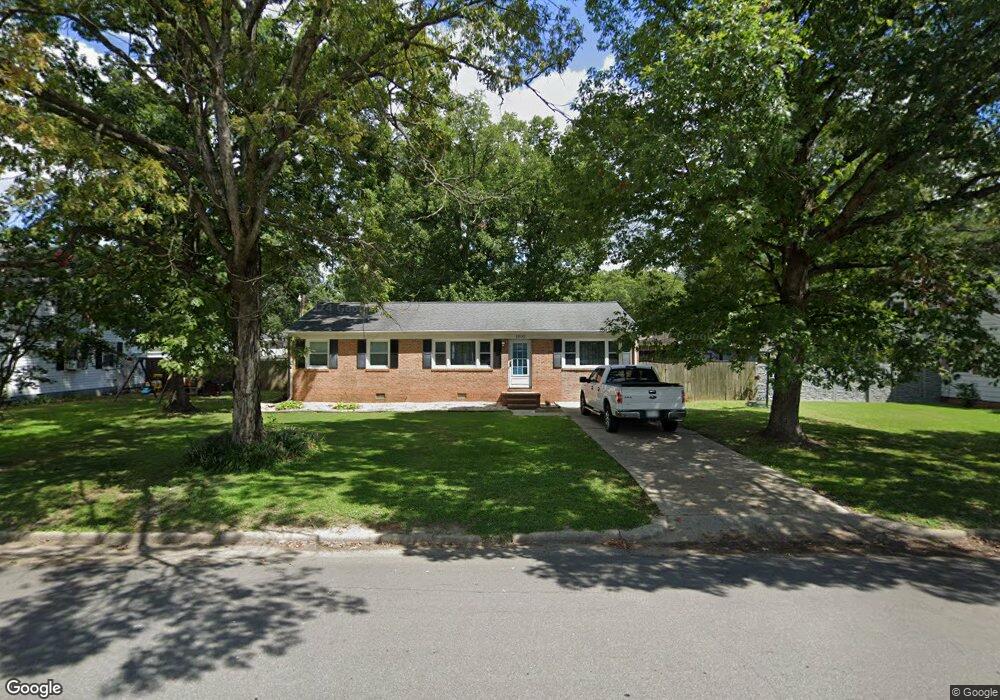
1902 Lee St West Point, VA 23181
Estimated Value: $237,974 - $269,000
3
Beds
1
Bath
1,323
Sq Ft
$188/Sq Ft
Est. Value
About This Home
This home is located at 1902 Lee St, West Point, VA 23181 and is currently estimated at $249,244, approximately $188 per square foot. 1902 Lee St is a home located in King William County with nearby schools including West Point Elementary School, West Point Middle School, and West Point High School.
Ownership History
Date
Name
Owned For
Owner Type
Purchase Details
Closed on
May 27, 2008
Sold by
Vincent Benajmin W
Bought by
Jenkins Elliot G
Current Estimated Value
Home Financials for this Owner
Home Financials are based on the most recent Mortgage that was taken out on this home.
Original Mortgage
$12,400
Outstanding Balance
$7,737
Interest Rate
5.94%
Mortgage Type
New Conventional
Estimated Equity
$241,507
Purchase Details
Closed on
Oct 11, 2005
Sold by
Hutchinson James T
Bought by
Vincent Benjamin W
Home Financials for this Owner
Home Financials are based on the most recent Mortgage that was taken out on this home.
Original Mortgage
$103,200
Interest Rate
5.81%
Mortgage Type
New Conventional
Create a Home Valuation Report for This Property
The Home Valuation Report is an in-depth analysis detailing your home's value as well as a comparison with similar homes in the area
Home Values in the Area
Average Home Value in this Area
Purchase History
| Date | Buyer | Sale Price | Title Company |
|---|---|---|---|
| Jenkins Elliot G | $155,000 | -- | |
| Vincent Benjamin W | $129,000 | -- |
Source: Public Records
Mortgage History
| Date | Status | Borrower | Loan Amount |
|---|---|---|---|
| Open | Vincent Benjamin W | $12,400 | |
| Previous Owner | Vincent Benjamin W | $103,200 |
Source: Public Records
Tax History
| Year | Tax Paid | Tax Assessment Tax Assessment Total Assessment is a certain percentage of the fair market value that is determined by local assessors to be the total taxable value of land and additions on the property. | Land | Improvement |
|---|---|---|---|---|
| 2025 | $505 | $165,700 | $30,000 | $135,700 |
| 2024 | $447 | $165,700 | $30,000 | $135,700 |
| 2023 | $961 | $165,700 | $30,000 | $135,700 |
| 2022 | $502 | $133,800 | $44,000 | $89,800 |
| 2021 | $508 | $133,800 | $44,000 | $89,800 |
| 2020 | $508 | $158,600 | $35,000 | $123,600 |
| 2019 | $508 | $132,700 | $44,000 | $88,700 |
| 2018 | $522 | $133,800 | $44,000 | $89,800 |
| 2017 | $542 | $133,800 | $44,000 | $89,800 |
| 2016 | $549 | $133,800 | $44,000 | $89,800 |
| 2015 | $575 | $133,800 | $44,000 | $89,800 |
| 2014 | $641 | $0 | $0 | $0 |
Source: Public Records
Map
Nearby Homes
Your Personal Tour Guide
Ask me questions while you tour the home.