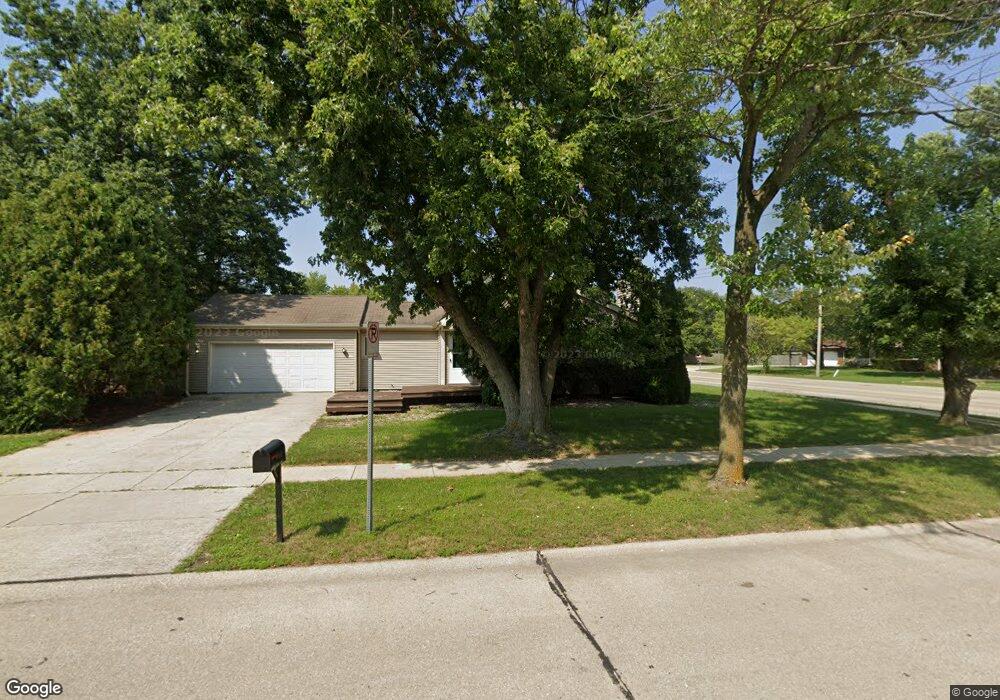
1902 Sumac Dr Champaign, IL 61821
West Haven NeighborhoodEstimated Value: $161,000 - $244,000
3
Beds
2
Baths
1,542
Sq Ft
$136/Sq Ft
Est. Value
About This Home
This home is located at 1902 Sumac Dr, Champaign, IL 61821 and is currently estimated at $210,343, approximately $136 per square foot. 1902 Sumac Dr is a home located in Champaign County with nearby schools including Centennial High School, Next Generation School, and St. Matthew School.
Ownership History
Date
Name
Owned For
Owner Type
Purchase Details
Closed on
Mar 18, 2025
Sold by
Jplp Properties Llc
Bought by
Bmbk Homes Llc 1902 Sumac Series
Current Estimated Value
Purchase Details
Closed on
Aug 22, 2018
Sold by
Yoon Harold
Bought by
Jplp Properties Llc
Purchase Details
Closed on
May 2, 2017
Sold by
Fannie Mae
Bought by
Yoon Harold
Home Financials for this Owner
Home Financials are based on the most recent Mortgage that was taken out on this home.
Original Mortgage
$73,000
Interest Rate
4.1%
Mortgage Type
New Conventional
Purchase Details
Closed on
Jan 19, 2017
Sold by
Freeman Brent Christopher and Freeman Brent C
Bought by
Federal National Mortgage Association
Create a Home Valuation Report for This Property
The Home Valuation Report is an in-depth analysis detailing your home's value as well as a comparison with similar homes in the area
Home Values in the Area
Average Home Value in this Area
Purchase History
| Date | Buyer | Sale Price | Title Company |
|---|---|---|---|
| Bmbk Homes Llc 1902 Sumac Series | $150,000 | None Listed On Document | |
| Jplp Properties Llc | -- | Attorney | |
| Yoon Harold | -- | None Available | |
| Federal National Mortgage Association | -- | None Available |
Source: Public Records
Mortgage History
| Date | Status | Borrower | Loan Amount |
|---|---|---|---|
| Previous Owner | Yoon Harold | $73,000 |
Source: Public Records
Tax History
| Year | Tax Paid | Tax Assessment Tax Assessment Total Assessment is a certain percentage of the fair market value that is determined by local assessors to be the total taxable value of land and additions on the property. | Land | Improvement |
|---|---|---|---|---|
| 2024 | $3,478 | $42,350 | $18,530 | $23,820 |
| 2023 | $3,478 | $38,570 | $16,880 | $21,690 |
| 2022 | $3,272 | $35,580 | $15,570 | $20,010 |
| 2021 | $3,193 | $34,880 | $15,260 | $19,620 |
| 2020 | $3,075 | $33,540 | $14,670 | $18,870 |
| 2019 | $2,976 | $32,850 | $14,370 | $18,480 |
| 2018 | $2,909 | $32,330 | $14,140 | $18,190 |
| 2017 | $2,921 | $32,330 | $14,140 | $18,190 |
| 2016 | $4,429 | $53,540 | $13,850 | $39,690 |
| 2015 | $4,462 | $52,590 | $13,600 | $38,990 |
| 2014 | $4,424 | $52,590 | $13,600 | $38,990 |
| 2013 | $4,384 | $52,590 | $13,600 | $38,990 |
Source: Public Records
Map
Nearby Homes
- 1901 Branch Rd
- 2218 S Mattis Ave
- 1901 Blackthorn Dr
- 1928 Blackthorn Dr Unit 1
- 2113 Sunview Dr
- 2111 Sunview Dr
- 2144 Harbortown Cir Unit 2144
- 2134 Harbortown Cir
- 2001 S Mattis Ave Unit E
- 2307 Branch Rd
- 2211 Carlisle Dr
- 2404 Windward Blvd Unit 202
- 2313 Glenoak Dr
- 1821 Alder Ln
- 1506 Sandpiper Ln
- 2018 Scottsdale Dr
- 1405 Old Farm Rd
- 2410 Stillwater Dr
- 1306 Lancaster Dr Unit 1306
- 2801 Valleybrook Dr
- 2306 Osage Ct
- 2304 Osage Ct
- 2309 Osage Ct
- 2307 Osage Ct
- 1903 Sumac Dr
- 2312 Osage Dr
- 2305 Osage Ct
- 2302 Osage Ct
- 2212 S Mattis Ave
- 2308 Sumac Ct N
- 2220 S Mattis Ave
- 2301 Osage Ct
- 1905 Sumac Dr
- 2314 Osage Dr
- 2306 S Mattis Ave
- 2306 Sumac Ct N
- 2303 Osage Ct
- 2313 Osage Dr
- 2304 Sumac Ct N
- 2210 S Mattis Ave
Your Personal Tour Guide
Ask me questions while you tour the home.