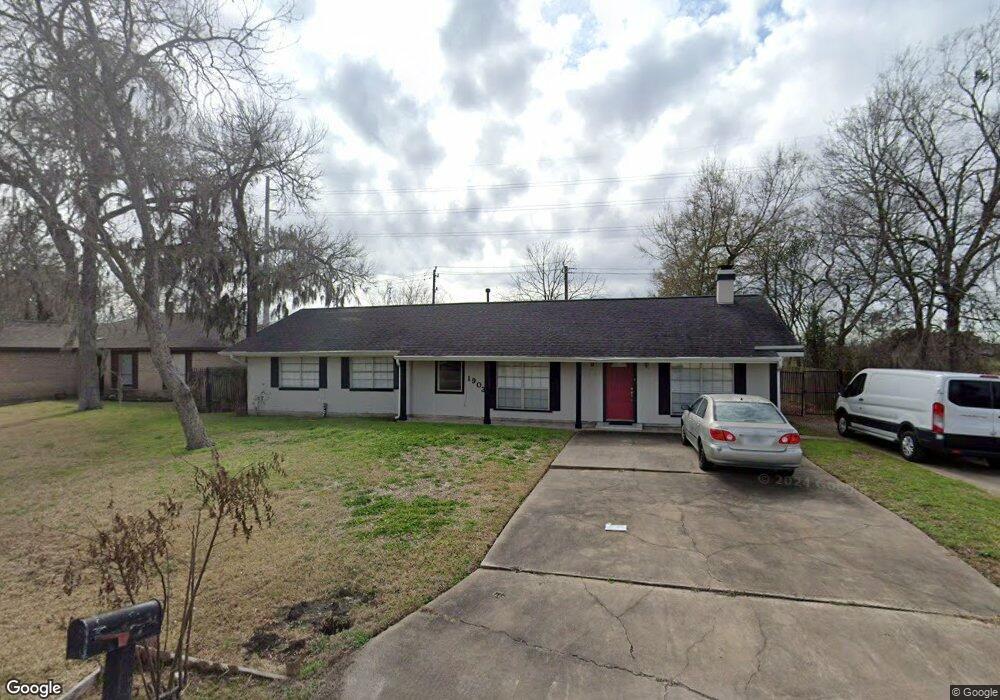
1903 Cypress Dr Richmond, TX 77469
Estimated Value: $267,491 - $290,000
4
Beds
3
Baths
2,088
Sq Ft
$135/Sq Ft
Est. Value
About This Home
This home is located at 1903 Cypress Dr, Richmond, TX 77469 and is currently estimated at $282,873, approximately $135 per square foot. 1903 Cypress Dr is a home located in Fort Bend County with nearby schools including Smith Elementary School, J J Wessendorff Middle School, and Lamar Junior High School.
Ownership History
Date
Name
Owned For
Owner Type
Purchase Details
Closed on
Dec 10, 2014
Sold by
Shsh Ventures Lp
Bought by
Padilla Raymond
Current Estimated Value
Home Financials for this Owner
Home Financials are based on the most recent Mortgage that was taken out on this home.
Original Mortgage
$99,946
Outstanding Balance
$76,755
Interest Rate
3.99%
Mortgage Type
VA
Estimated Equity
$206,118
Purchase Details
Closed on
Jul 25, 2014
Sold by
Wells Fargo Bank Na
Bought by
Shsh Ventures Lp
Purchase Details
Closed on
Mar 4, 2014
Sold by
Taylor Virginia B
Bought by
Wells Fargo Bank Na
Purchase Details
Closed on
Jun 2, 2004
Sold by
Ohara Robert and Ohara Christine French
Bought by
Taylor Virginia B
Home Financials for this Owner
Home Financials are based on the most recent Mortgage that was taken out on this home.
Original Mortgage
$119,700
Interest Rate
5.97%
Mortgage Type
Purchase Money Mortgage
Create a Home Valuation Report for This Property
The Home Valuation Report is an in-depth analysis detailing your home's value as well as a comparison with similar homes in the area
Home Values in the Area
Average Home Value in this Area
Purchase History
| Date | Buyer | Sale Price | Title Company |
|---|---|---|---|
| Padilla Raymond | -- | Charter Title Co Fort Bend | |
| Shsh Ventures Lp | -- | Servicelink | |
| Padilla Raymond | -- | -- | |
| Wells Fargo Bank Na | $110,800 | None Available | |
| Padilla Raymond | -- | -- | |
| Taylor Virginia B | -- | Charter Title |
Source: Public Records
Mortgage History
| Date | Status | Borrower | Loan Amount |
|---|---|---|---|
| Open | Padilla Raymond | $99,946 | |
| Previous Owner | Taylor Virginia B | $119,700 |
Source: Public Records
Tax History Compared to Growth
Tax History
| Year | Tax Paid | Tax Assessment Tax Assessment Total Assessment is a certain percentage of the fair market value that is determined by local assessors to be the total taxable value of land and additions on the property. | Land | Improvement |
|---|---|---|---|---|
| 2025 | $3,930 | $242,641 | $24,453 | $218,188 |
| 2024 | $3,930 | $249,405 | $14,550 | $234,855 |
| 2023 | $3,522 | $226,732 | $0 | $257,260 |
| 2022 | $3,958 | $206,120 | $0 | $215,190 |
| 2021 | $4,450 | $187,380 | $18,810 | $168,570 |
| 2020 | $4,373 | $181,450 | $18,810 | $162,640 |
| 2019 | $4,618 | $180,840 | $18,810 | $162,030 |
| 2018 | $4,588 | $178,600 | $18,810 | $159,790 |
| 2017 | $4,414 | $169,840 | $15,820 | $154,020 |
| 2016 | $4,153 | $159,770 | $15,820 | $143,950 |
| 2015 | $3,298 | $151,660 | $15,820 | $135,840 |
| 2014 | $3,274 | $136,260 | $15,820 | $120,440 |
Source: Public Records
Map
Nearby Homes
- 1806 Cedar Dr
- 1809 Hawthorn Dr
- 1805 Hawthorn Dr
- 4502 River Rd
- 1922 Teakwood St
- 1109 Frances Dr
- 000 Fm 2218 Rd
- 1230 Law Ct
- 5121 Alderney Ct
- 0 Fm 2218 Unit 25550047
- 1004 Country Club Dr
- 5106 Alderney Ct
- 6303 Buffalo Bend Ln
- 1403 Divin Dr
- 4602 Avenue H
- The Royal (L481) Plan at Wall Street Village
- The Henderson (L404) Plan at Wall Street Village
- The Kendall (L485) Plan at Wall Street Village
- The Preston (L403) Plan at Wall Street Village
- The Greenville (L400) Plan at Wall Street Village
- 1901 Cypress Dr
- 1811 Cypress Dr
- 1902 Cypress Dr
- 1906 Cedar Dr
- 1809 Cypress Dr
- 1810 Cypress Dr
- 1902 Cedar Dr
- 1808 Cypress Dr
- 1805 Cypress Dr
- 1806 Cypress Dr
- 1900 Cedar Dr
- 1809 Willow Dr
- 1807 Willow Dr
- 1803 Cypress Dr
- 1804 Cypress Dr
- 1805 Willow Dr
- 1802 Cypress Dr
- 1802 Cypress Dr
- 1801 Cypress Dr
- 1803 Willow Dr