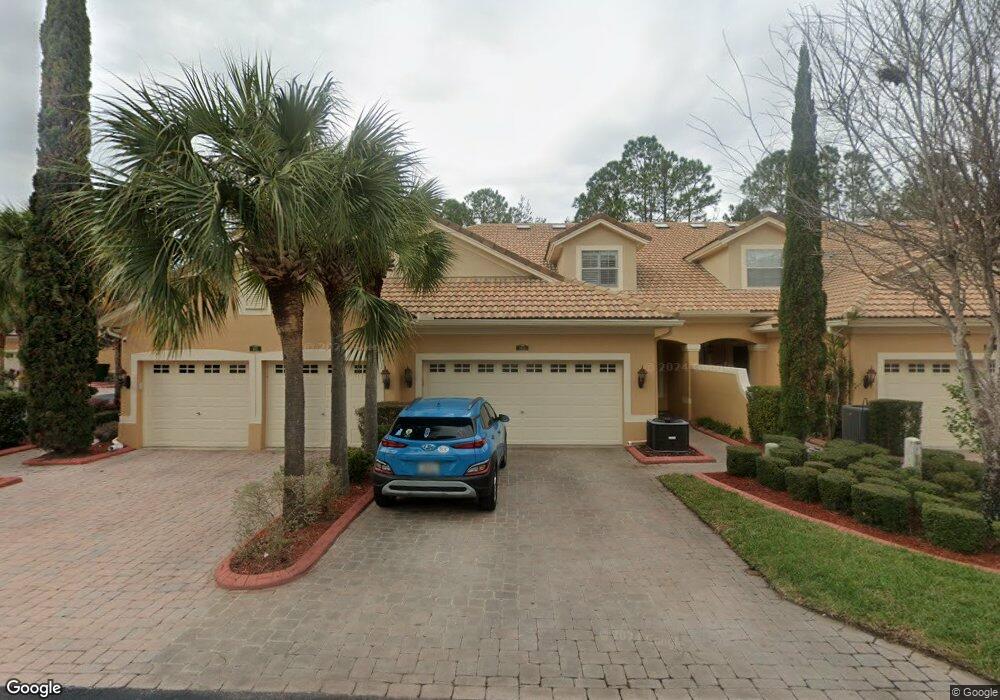
1903 Paw Paw Place Trinity, FL 34655
Estimated Value: $415,203 - $476,000
Studio
3
Baths
2,223
Sq Ft
$201/Sq Ft
Est. Value
About This Home
This home is located at 1903 Paw Paw Place, Trinity, FL 34655 and is currently estimated at $447,051, approximately $201 per square foot. 1903 Paw Paw Place is a home located in Pasco County with nearby schools including Trinity Oaks Elementary School, Seven Springs Middle School, and James W. Mitchell High School.
Ownership History
Date
Name
Owned For
Owner Type
Purchase Details
Closed on
Jun 19, 2019
Sold by
Michels Robin L
Bought by
Michels Robin L and Robin L Michels Revocable Trust
Current Estimated Value
Purchase Details
Closed on
Dec 28, 2018
Sold by
Harvan Michael R and Harvan Clemma L
Bought by
Michels Robin L
Purchase Details
Closed on
Jun 29, 2012
Sold by
Garton Edward J and Garton Laurie A
Bought by
Harvan Michael R and Harvan Clemma L
Home Financials for this Owner
Home Financials are based on the most recent Mortgage that was taken out on this home.
Original Mortgage
$128,000
Interest Rate
3.76%
Mortgage Type
New Conventional
Purchase Details
Closed on
Jan 5, 2007
Sold by
Schickendanz Bros Pinellas Ltd
Bought by
Garton Edward J
Home Financials for this Owner
Home Financials are based on the most recent Mortgage that was taken out on this home.
Original Mortgage
$263,200
Interest Rate
7.5%
Mortgage Type
Unknown
Create a Home Valuation Report for This Property
The Home Valuation Report is an in-depth analysis detailing your home's value as well as a comparison with similar homes in the area
Home Values in the Area
Average Home Value in this Area
Purchase History
| Date | Buyer | Sale Price | Title Company |
|---|---|---|---|
| Michels Robin L | -- | Attorney | |
| Michels Robin L | $285,000 | Master Title Service Inc | |
| Harvan Michael R | $160,000 | Attorney | |
| Garton Edward J | $329,000 | Attorney |
Source: Public Records
Mortgage History
| Date | Status | Borrower | Loan Amount |
|---|---|---|---|
| Previous Owner | Harvan Michael R | $128,000 | |
| Previous Owner | Garton Edward J | $263,200 |
Source: Public Records
Tax History
| Year | Tax Paid | Tax Assessment Tax Assessment Total Assessment is a certain percentage of the fair market value that is determined by local assessors to be the total taxable value of land and additions on the property. | Land | Improvement |
|---|---|---|---|---|
| 2026 | $2,997 | $223,010 | -- | -- |
| 2025 | $2,997 | $223,010 | -- | -- |
| 2024 | $2,997 | $210,630 | -- | -- |
| 2023 | $2,879 | $204,500 | $0 | $0 |
| 2022 | $2,649 | $198,550 | $0 | $0 |
| 2021 | $2,594 | $192,770 | $31,860 | $160,910 |
| 2020 | $2,550 | $190,110 | $31,860 | $158,250 |
| 2019 | $2,502 | $185,842 | $31,860 | $153,982 |
| 2018 | $3,820 | $226,072 | $31,860 | $194,212 |
| 2017 | $3,700 | $214,481 | $31,860 | $182,621 |
| 2016 | $3,459 | $199,479 | $31,681 | $167,798 |
| 2015 | $3,413 | $192,627 | $31,681 | $160,946 |
| 2014 | $3,293 | $189,367 | $31,681 | $157,686 |
Source: Public Records
Map
Nearby Homes
- 1900 Paw Place
- 7305 Gaberia Rd
- 7246 Gaberia Rd
- 7320 Hideaway Trail
- 7501 Fawn Lake Rd
- 7212 Otter Creek Dr
- 7115 Hummingbird Ln
- 2247 Ground Squirrel Dr
- 1809 Orchardgrove Ave
- 1747 Orchardgrove Ave
- 1610 Cortleigh Dr
- 1522 Haverhill Dr
- 7404 Newburns Place Unit 3
- 1648 Orchardgrove Ave
- 1615 Orchardgrove Ave
- 6938 Coronet Dr
- 7703 Northaven Place
- 1319 Hoversham Dr
- 7636 Wimpole Dr
- 1716 Percheron Dr
- 1903 Paw Place
- 1905 Paw Place
- 1905 Paw Paw Place
- 1901 Paw Paw Place
- 1901 Paw Place Unit 1901
- 1901 Paw Place
- 1907 Paw Place
- 1907 Paw Paw Place
- 1909 Paw Paw Place
- 1911 Paw Place
- 1911 Paw Paw Place
- 7406 Whiskfern Rd
- 7404 Whiskfern Rd
- 7402 Whiskfern Rd
- 7410 Whiskfern Rd
- 1902 Paw Paw Place
- 1904 Paw Paw Place
- 1902 Paw Place
- 1906 Paw Paw Place
Your Personal Tour Guide
Ask me questions while you tour the home.