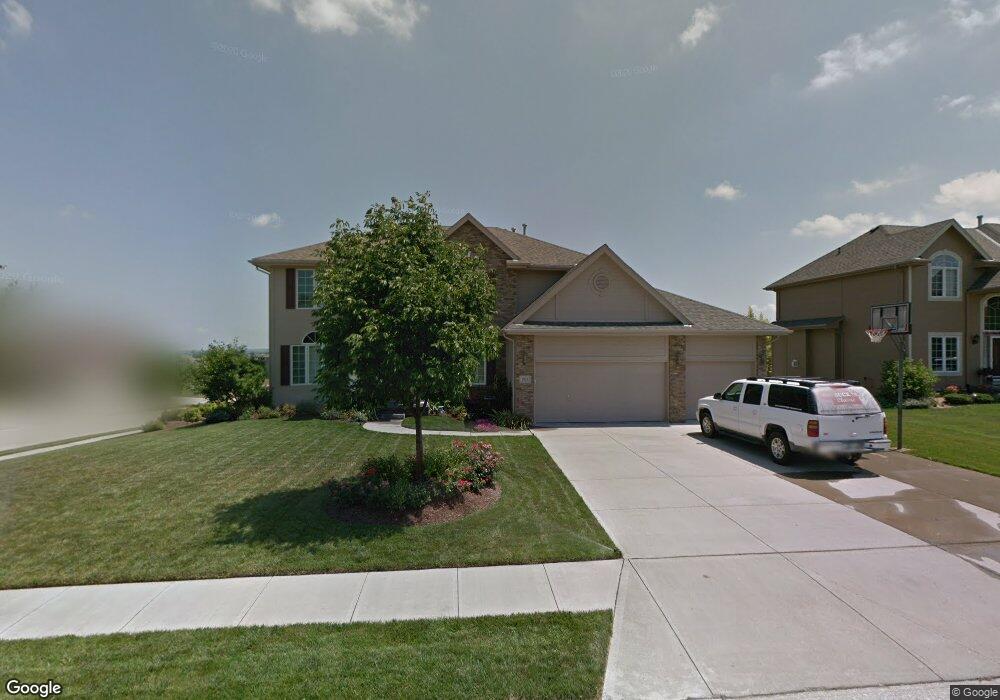
1903 Petersen Dr Papillion, NE 68046
Estimated Value: $519,619 - $545,000
5
Beds
6
Baths
4,084
Sq Ft
$131/Sq Ft
Est. Value
About This Home
This home is located at 1903 Petersen Dr, Papillion, NE 68046 and is currently estimated at $536,655, approximately $131 per square foot. 1903 Petersen Dr is a home located in Sarpy County with nearby schools including Walnut Creek Elementary School, Papillion Middle School, and Papillion La Vista South High School.
Ownership History
Date
Name
Owned For
Owner Type
Purchase Details
Closed on
May 24, 2018
Sold by
Schendt John M and Schendt Karin L
Bought by
Muma Vincent and Fryzek Amanda L
Current Estimated Value
Home Financials for this Owner
Home Financials are based on the most recent Mortgage that was taken out on this home.
Original Mortgage
$316,800
Outstanding Balance
$272,775
Interest Rate
4.4%
Estimated Equity
$263,880
Purchase Details
Closed on
Feb 6, 2006
Sold by
Monarch Construction Inc
Bought by
Schendt John M and Schendt Karin L
Home Financials for this Owner
Home Financials are based on the most recent Mortgage that was taken out on this home.
Original Mortgage
$331,000
Interest Rate
6.18%
Purchase Details
Closed on
Aug 17, 2005
Sold by
Edgewater On The Park Llc
Bought by
Monarch Construction Inc
Create a Home Valuation Report for This Property
The Home Valuation Report is an in-depth analysis detailing your home's value as well as a comparison with similar homes in the area
Home Values in the Area
Average Home Value in this Area
Purchase History
| Date | Buyer | Sale Price | Title Company |
|---|---|---|---|
| Muma Vincent | $398,000 | Midwest Title Inc | |
| Schendt John M | $368,000 | Btc | |
| Monarch Construction Inc | $54,000 | -- |
Source: Public Records
Mortgage History
| Date | Status | Borrower | Loan Amount |
|---|---|---|---|
| Open | Muma Vincent | $316,800 | |
| Previous Owner | Schendt John M | $331,000 |
Source: Public Records
Tax History Compared to Growth
Tax History
| Year | Tax Paid | Tax Assessment Tax Assessment Total Assessment is a certain percentage of the fair market value that is determined by local assessors to be the total taxable value of land and additions on the property. | Land | Improvement |
|---|---|---|---|---|
| 2025 | $8,806 | $495,882 | $65,000 | $430,882 |
| 2024 | $10,080 | $478,130 | $60,000 | $418,130 |
| 2023 | $10,080 | $456,230 | $57,000 | $399,230 |
| 2022 | $9,560 | $403,895 | $52,000 | $351,895 |
| 2021 | $9,214 | $378,427 | $49,000 | $329,427 |
| 2020 | $9,132 | $373,806 | $46,000 | $327,806 |
| 2019 | $9,054 | $365,135 | $46,000 | $319,135 |
| 2018 | $9,323 | $363,100 | $42,000 | $321,100 |
| 2017 | $9,252 | $346,964 | $42,000 | $304,964 |
| 2016 | $9,117 | $335,128 | $42,000 | $293,128 |
| 2015 | $8,837 | $324,664 | $42,000 | $282,664 |
| 2014 | $8,909 | $320,652 | $42,000 | $278,652 |
| 2012 | -- | $316,965 | $41,000 | $275,965 |
Source: Public Records
Map
Nearby Homes
- 1806 Walnut Creek Dr
- 2006 Diane St
- 1704 Southview Dr
- 814 Clearwater Dr
- 812 Lake Tahoe Dr
- 2010 Ridgeview Dr
- 2105 Petersen Dr
- 1104 Gold Coast Rd
- 2110 S Mineral Dr
- 2221 Placid Lake Dr
- 12001 S 90th St
- 701 Fenwick St
- 2070 Stillwater Dr
- 2231 Crystal Creek Dr
- 1004 Berkley Ave
- 501 Kent Dr
- 2404 Walnut Creek Dr
- 2241 Glacier Dr
- 1125 Rawhide Rd
- 1203 Rawhide Rd
- 1905 Petersen Dr
- 1902 Lakewood Dr
- 1904 Lakewood Dr
- 1004 Lake Vista Dr
- 1006 Lake Vista Dr
- 1902 Petersen Dr
- 1907 Petersen Dr
- 1904 Petersen Dr
- 1002 Lake Vista Dr
- 1008 Lake Vista Dr
- 1906 Lakewood Dr
- 1906 Petersen Dr
- 1909 Petersen Dr
- 1010 Lake Vista Dr
- 1003 Clearwater Dr
- 1005 Clearwater Dr
- 1908 Lakewood Dr
- 1001 Clearwater Dr
- 1905 Diane Dr
- 1908 Petersen Dr