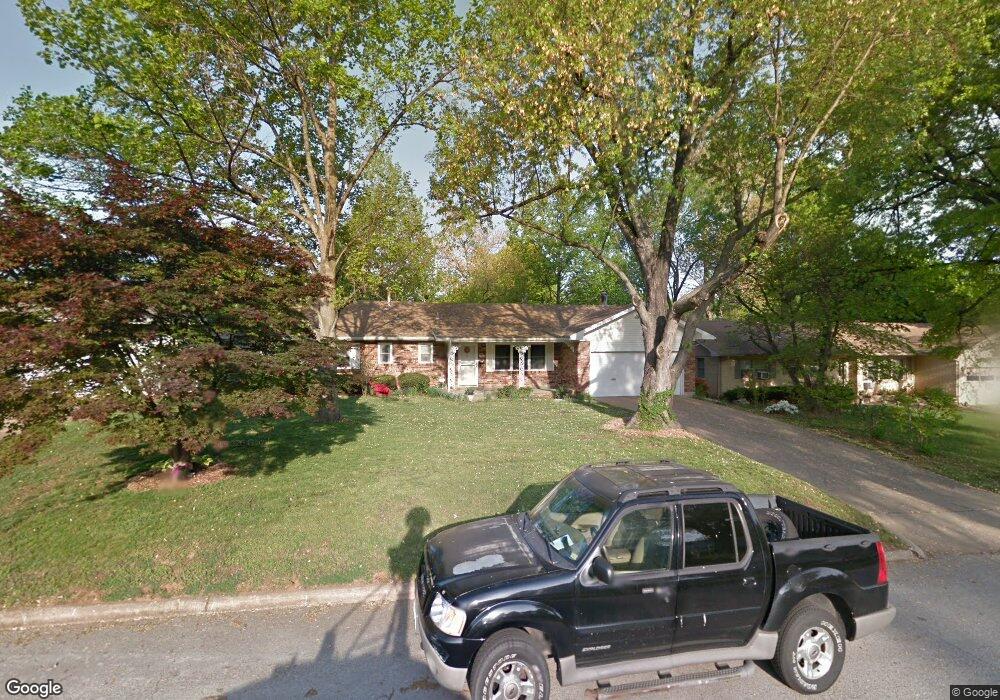
1903 S Nettleton Ave Springfield, MO 65807
Mark Twain NeighborhoodEstimated Value: $220,000 - $234,000
3
Beds
2
Baths
1,512
Sq Ft
$149/Sq Ft
Est. Value
About This Home
This home is located at 1903 S Nettleton Ave, Springfield, MO 65807 and is currently estimated at $224,653, approximately $148 per square foot. 1903 S Nettleton Ave is a home located in Greene County with nearby schools including Sunshine Elementary School, Jarrett Middle, and Parkview High School.
Ownership History
Date
Name
Owned For
Owner Type
Purchase Details
Closed on
Dec 21, 2023
Sold by
Beverly A Cox Revocable Trust
Bought by
Cox Brandon
Current Estimated Value
Purchase Details
Closed on
Nov 16, 2020
Sold by
Kuhns Justin
Bought by
Cox Brandon Lee
Purchase Details
Closed on
Aug 8, 2013
Sold by
Cox Beverly A
Bought by
Cox Beverly A
Home Financials for this Owner
Home Financials are based on the most recent Mortgage that was taken out on this home.
Original Mortgage
$10,000
Interest Rate
4.42%
Mortgage Type
Credit Line Revolving
Purchase Details
Closed on
Sep 14, 2010
Sold by
Cox Virgina Sue
Bought by
Cox Beverly A
Purchase Details
Closed on
Jun 20, 2005
Sold by
Cox Virginia Sue
Bought by
Cox Virginia Sue and Cox Beverly A
Create a Home Valuation Report for This Property
The Home Valuation Report is an in-depth analysis detailing your home's value as well as a comparison with similar homes in the area
Home Values in the Area
Average Home Value in this Area
Purchase History
| Date | Buyer | Sale Price | Title Company |
|---|---|---|---|
| Cox Brandon | -- | None Listed On Document | |
| Cox Brandon Lee | -- | None Available | |
| Cox Beverly A | -- | None Available | |
| Cox Beverly A | -- | None Available | |
| Cox Virginia Sue | -- | None Available |
Source: Public Records
Mortgage History
| Date | Status | Borrower | Loan Amount |
|---|---|---|---|
| Previous Owner | Cox Beverly A | $10,000 |
Source: Public Records
Tax History
| Year | Tax Paid | Tax Assessment Tax Assessment Total Assessment is a certain percentage of the fair market value that is determined by local assessors to be the total taxable value of land and additions on the property. | Land | Improvement |
|---|---|---|---|---|
| 2025 | $1,259 | $25,270 | $5,700 | $19,570 |
| 2024 | $1,199 | $22,350 | $4,450 | $17,900 |
| 2023 | $1,192 | $22,350 | $4,450 | $17,900 |
| 2022 | $1,115 | $20,410 | $4,450 | $15,960 |
| 2021 | $1,115 | $20,410 | $4,450 | $15,960 |
| 2020 | $1,038 | $18,170 | $4,450 | $13,720 |
| 2019 | $1,008 | $18,170 | $4,450 | $13,720 |
| 2018 | $932 | $16,800 | $4,450 | $12,350 |
| 2017 | $923 | $15,890 | $4,450 | $11,440 |
| 2016 | $871 | $15,890 | $4,450 | $11,440 |
| 2015 | $863 | $15,890 | $4,450 | $11,440 |
| 2014 | $851 | $15,550 | $4,450 | $11,100 |
Source: Public Records
Map
Nearby Homes
- 1846 S Nettleton Ave
- 1962 S Westwood Ave
- 1825 S Weaver Ave
- 1419 W Whiteside St
- 1949 S Broadway Ave
- 1010 W Cherokee St
- 1711 W Whiteside St
- 1717 W Elfindale St Unit 3c
- 1107 W Tracy St
- 1733 S Lancaster Ave
- 901 W Portland St
- 1503 W Broadmoor St
- 1632 W Berkeley St
- 1750 W Bennett St Unit 4b
- 810 W Minota St
- 1514 W Broadmoor St
- 816 W Ildereen St
- 1116 W Broadmoor St
- 1318 S Newton Ave
- 701 W Minota St
- 1855 S Nettleton Ave
- 1909 S Nettleton Ave
- 1914 S Westwood Ave
- 1910 S Westwood Ave
- 1847 S Nettleton Ave
- 1917 S Nettleton Ave
- 1916 S Westwood Ave
- 1902 S Nettleton Ave
- 1854 S Westwood Ave
- 1854 S Nettleton Ave
- 1910 S Nettleton Ave
- 1925 S Nettleton Ave
- 1839 S Nettleton Ave
- 1924 S Westwood Ave
- 1916 S Nettleton Ave
- 1840 S Westwood Ave
- 0 O Hwy Unit 11404550
- 0 O Hwy Unit 11404549
- 0 O Hwy Unit 20108919
- 0 O Hwy Unit 11404545
Your Personal Tour Guide
Ask me questions while you tour the home.