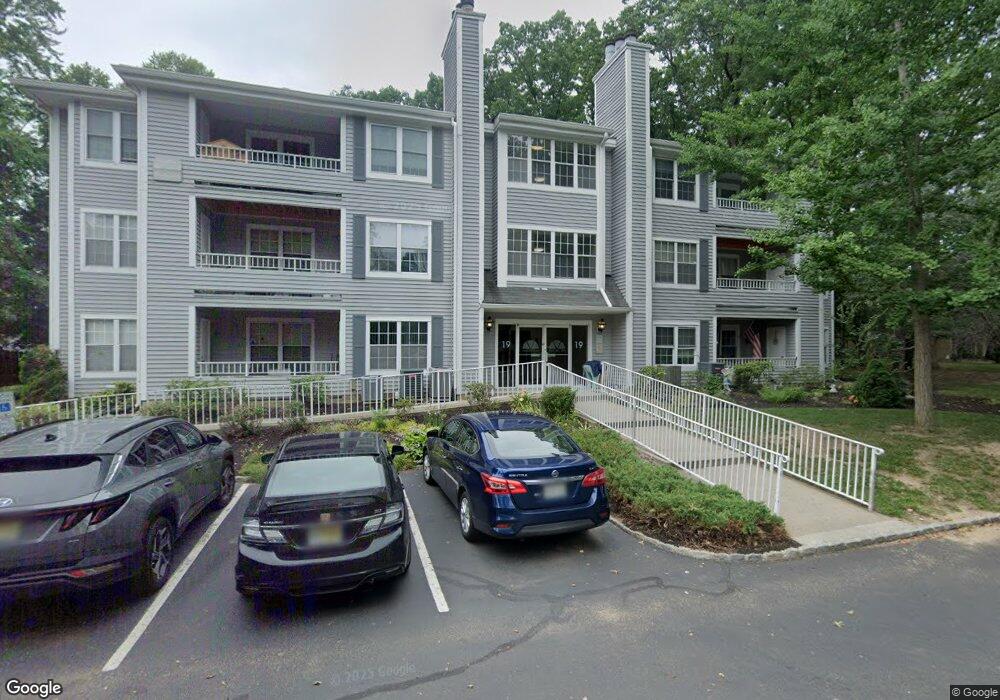
1903 Tanglewood Ct Helmetta, NJ 08828
Estimated Value: $296,925 - $323,000
--
Bed
--
Bath
1,039
Sq Ft
$295/Sq Ft
Est. Value
About This Home
This home is located at 1903 Tanglewood Ct, Helmetta, NJ 08828 and is currently estimated at $306,481, approximately $294 per square foot. 1903 Tanglewood Ct is a home located in Middlesex County with nearby schools including G. Austin Schoenly Elementary School, E. Raymond Appleby Elementary School, and Spotswood Memorial School.
Ownership History
Date
Name
Owned For
Owner Type
Purchase Details
Closed on
Mar 19, 2018
Sold by
Eckhardt Robert O
Bought by
Molughney Paul K
Current Estimated Value
Home Financials for this Owner
Home Financials are based on the most recent Mortgage that was taken out on this home.
Original Mortgage
$132,000
Outstanding Balance
$113,113
Interest Rate
4.38%
Mortgage Type
New Conventional
Estimated Equity
$193,368
Purchase Details
Closed on
Jul 8, 2003
Sold by
Mcclure Patricia Cheryl
Bought by
Eckhardt Robert
Home Financials for this Owner
Home Financials are based on the most recent Mortgage that was taken out on this home.
Original Mortgage
$129,000
Interest Rate
5.28%
Purchase Details
Closed on
Jul 31, 1998
Sold by
Lin Jenny
Bought by
Mcclure Patricia
Home Financials for this Owner
Home Financials are based on the most recent Mortgage that was taken out on this home.
Original Mortgage
$75,050
Interest Rate
6.92%
Create a Home Valuation Report for This Property
The Home Valuation Report is an in-depth analysis detailing your home's value as well as a comparison with similar homes in the area
Home Values in the Area
Average Home Value in this Area
Purchase History
| Date | Buyer | Sale Price | Title Company |
|---|---|---|---|
| Molughney Paul K | $165,000 | Old Republic Title Ins Co | |
| Eckhardt Robert | $149,000 | -- | |
| Mcclure Patricia | $79,000 | -- |
Source: Public Records
Mortgage History
| Date | Status | Borrower | Loan Amount |
|---|---|---|---|
| Open | Molughney Paul K | $132,000 | |
| Previous Owner | Eckhardt Robert | $129,000 | |
| Previous Owner | Mcclure Patricia | $75,050 |
Source: Public Records
Tax History Compared to Growth
Tax History
| Year | Tax Paid | Tax Assessment Tax Assessment Total Assessment is a certain percentage of the fair market value that is determined by local assessors to be the total taxable value of land and additions on the property. | Land | Improvement |
|---|---|---|---|---|
| 2025 | $4,287 | $126,500 | $50,000 | $76,500 |
| 2024 | $4,126 | $126,500 | $50,000 | $76,500 |
| 2023 | $4,126 | $126,500 | $50,000 | $76,500 |
| 2022 | $4,090 | $126,500 | $50,000 | $76,500 |
| 2021 | $2,965 | $126,500 | $50,000 | $76,500 |
| 2020 | $3,873 | $126,500 | $50,000 | $76,500 |
| 2019 | $3,908 | $126,500 | $50,000 | $76,500 |
| 2018 | $3,857 | $126,500 | $50,000 | $76,500 |
| 2017 | $3,786 | $126,500 | $50,000 | $76,500 |
| 2016 | $3,636 | $126,500 | $50,000 | $76,500 |
| 2015 | $3,472 | $126,500 | $50,000 | $76,500 |
| 2014 | $3,432 | $126,500 | $50,000 | $76,500 |
Source: Public Records
Map
Nearby Homes
- 21 Madeline Ct
- 20 Borghaus Rd
- 1109 Stoneridge Cir Unit 9
- 1109 Stoneridge Cir
- 908 Meadow Ct
- 180 Kenneth Ct Unit 88-180
- 1007 Meadow Ct
- 105 Spotswood Dr Unit 88-105
- 7 Lake Ave
- 101 Spotswood Dr Unit 88-101
- 139 Village Dr W
- 24 Pennington Ave
- 0-0 Sommerdale St
- 7 Avenue B
- 5 Sutton Place
- 21 Rieder Rd
- 24 Holly House Dr
- 16 Sheryl Ct Unit 88-016
- 26 N Shore Blvd
- 306 Pine View Way Unit 88-306
- 1910 Tanglewood Ct
- 1907 Tanglewood Ct Unit 1907
- 1911 Tanglewood Ct Unit 1911
- 1906 Tanglewood Ct Unit 1906
- 1902 Tanglewood Ct Unit 1902
- 1908 Tanglewood Ct
- 1909 Tanglewood Ct
- 1912 Tanglewood Ct
- 1904 Tanglewood Ct
- 1905 Tanglewood Ct
- 1901 Tanglewood Ct
- 27 Madeline Ct
- 29 Madeline Ct
- 2803 Ridgefield Ct
- 2807 Ridgefield Ct Unit 2807
- 2811 Ridgefield Ct
- 2804 Ridgefield Ct Unit 4
- 1804 Tanglewood Ct
- 25 Madeline Ct
- 2808 Ridgefield Ct