1903 W 17th St Texarkana, TX 75501
Estimated Value: $46,000 - $88,000
--
Bed
--
Bath
1,120
Sq Ft
$57/Sq Ft
Est. Value
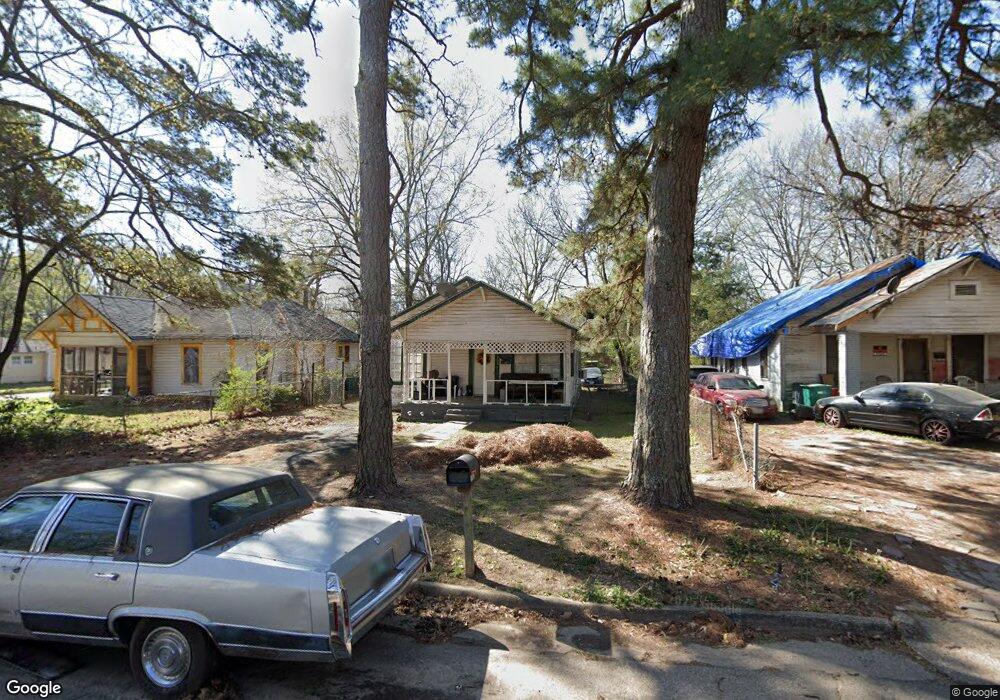
About This Home
This home is located at 1903 W 17th St, Texarkana, TX 75501 and is currently estimated at $63,326, approximately $56 per square foot. 1903 W 17th St is a home located in Bowie County with nearby schools including Theron Jones Early Literacy Center, Westlawn Elementary School, and Texas Middle School.
Ownership History
Date
Name
Owned For
Owner Type
Purchase Details
Closed on
Feb 22, 2019
Sold by
Miracle Pointe Development Lp
Bought by
Copeland Alisha and Robinson Gardarrell
Current Estimated Value
Home Financials for this Owner
Home Financials are based on the most recent Mortgage that was taken out on this home.
Original Mortgage
$39,250
Outstanding Balance
$24,724
Interest Rate
3.8%
Mortgage Type
New Conventional
Estimated Equity
$38,602
Purchase Details
Closed on
May 3, 2013
Sold by
Archie Qantrell and Archie Angelica M
Bought by
Forsyth Edwin J and Forsyth Dorette
Purchase Details
Closed on
Nov 22, 2010
Sold by
Forsyth Edwin J and Forsyth Dorette
Bought by
Archie Quantrell
Home Financials for this Owner
Home Financials are based on the most recent Mortgage that was taken out on this home.
Original Mortgage
$35,000
Interest Rate
4.27%
Mortgage Type
Purchase Money Mortgage
Create a Home Valuation Report for This Property
The Home Valuation Report is an in-depth analysis detailing your home's value as well as a comparison with similar homes in the area
Home Values in the Area
Average Home Value in this Area
Purchase History
| Date | Buyer | Sale Price | Title Company |
|---|---|---|---|
| Copeland Alisha | -- | None Available | |
| Forsyth Edwin J | -- | None Available | |
| Archie Quantrell | -- | None Available |
Source: Public Records
Mortgage History
| Date | Status | Borrower | Loan Amount |
|---|---|---|---|
| Open | Copeland Alisha | $39,250 | |
| Previous Owner | Archie Quantrell | $35,000 |
Source: Public Records
Tax History Compared to Growth
Tax History
| Year | Tax Paid | Tax Assessment Tax Assessment Total Assessment is a certain percentage of the fair market value that is determined by local assessors to be the total taxable value of land and additions on the property. | Land | Improvement |
|---|---|---|---|---|
| 2025 | $601 | $26,375 | $1,000 | $25,375 |
| 2024 | $601 | $25,406 | $1,000 | $24,406 |
| 2023 | $594 | $25,100 | $1,000 | $24,100 |
| 2022 | $538 | $22,518 | $1,000 | $21,518 |
| 2021 | $475 | $18,572 | $1,000 | $17,572 |
| 2020 | $419 | $16,281 | $1,000 | $15,281 |
| 2019 | $422 | $15,836 | $1,000 | $14,836 |
| 2018 | $411 | $15,405 | $1,000 | $14,405 |
| 2017 | $402 | $15,121 | $1,000 | $14,121 |
| 2016 | $402 | $15,121 | $1,000 | $14,121 |
| 2015 | $520 | $15,121 | $1,000 | $14,121 |
| 2014 | $520 | $20,103 | $1,000 | $19,103 |
Source: Public Records
Map
Nearby Homes