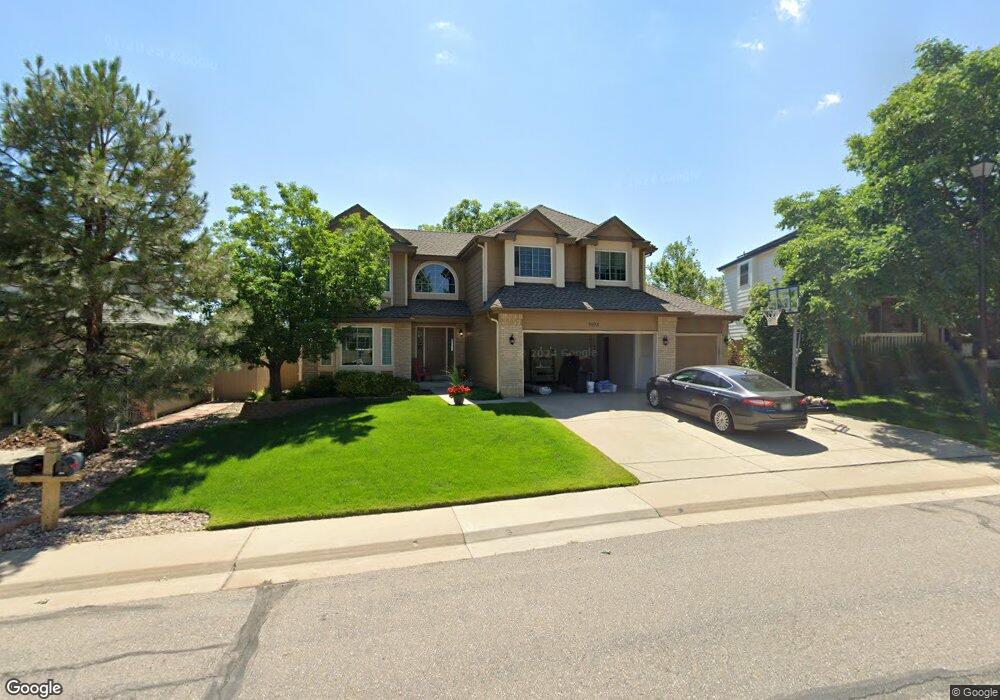
1904 Breen Ln Superior, CO 80027
Estimated Value: $1,008,363 - $1,105,000
5
Beds
4
Baths
3,613
Sq Ft
$295/Sq Ft
Est. Value
About This Home
This home is located at 1904 Breen Ln, Superior, CO 80027 and is currently estimated at $1,067,091, approximately $295 per square foot. 1904 Breen Ln is a home located in Boulder County with nearby schools including Eldorado K-8 School, Superior Elementary School, and Monarch High School.
Ownership History
Date
Name
Owned For
Owner Type
Purchase Details
Closed on
Jan 22, 2008
Sold by
Archbold Stephanie Z
Bought by
Trujillo Toby and Trujillo Jennifer
Current Estimated Value
Home Financials for this Owner
Home Financials are based on the most recent Mortgage that was taken out on this home.
Original Mortgage
$360,000
Outstanding Balance
$226,646
Interest Rate
6.11%
Mortgage Type
Purchase Money Mortgage
Estimated Equity
$840,445
Purchase Details
Closed on
Feb 4, 2000
Sold by
Archbold James R and Archbold Stepanie Z
Bought by
Archbold Stephanie Z
Purchase Details
Closed on
Nov 30, 1993
Sold by
Richmond Homes Inc Ii
Bought by
Archbold James R
Home Financials for this Owner
Home Financials are based on the most recent Mortgage that was taken out on this home.
Original Mortgage
$179,000
Interest Rate
6.71%
Purchase Details
Closed on
Mar 16, 1993
Bought by
Trujillo Toby and Trujillo Jennifer
Purchase Details
Closed on
Aug 17, 1992
Bought by
Trujillo Toby and Trujillo Jennifer
Create a Home Valuation Report for This Property
The Home Valuation Report is an in-depth analysis detailing your home's value as well as a comparison with similar homes in the area
Home Values in the Area
Average Home Value in this Area
Purchase History
| Date | Buyer | Sale Price | Title Company |
|---|---|---|---|
| Trujillo Toby | $450,000 | Land Title | |
| Archbold Stephanie Z | -- | -- | |
| Archbold James R | $223,765 | Land Title | |
| Trujillo Toby | -- | -- | |
| Trujillo Toby | -- | -- |
Source: Public Records
Mortgage History
| Date | Status | Borrower | Loan Amount |
|---|---|---|---|
| Open | Trujillo Toby | $360,000 | |
| Previous Owner | Archbold James R | $179,000 |
Source: Public Records
Tax History
| Year | Tax Paid | Tax Assessment Tax Assessment Total Assessment is a certain percentage of the fair market value that is determined by local assessors to be the total taxable value of land and additions on the property. | Land | Improvement |
|---|---|---|---|---|
| 2025 | $6,570 | $62,775 | $24,581 | $38,194 |
| 2024 | $6,570 | $62,775 | $24,581 | $38,194 |
| 2023 | $6,480 | $63,409 | $21,608 | $45,486 |
| 2022 | $5,007 | $47,864 | $16,909 | $30,955 |
| 2021 | $5,405 | $53,525 | $18,912 | $34,613 |
| 2020 | $5,036 | $47,926 | $19,305 | $28,621 |
| 2019 | $4,965 | $47,926 | $19,305 | $28,621 |
| 2018 | $4,543 | $43,430 | $13,392 | $30,038 |
| 2017 | $4,643 | $48,015 | $14,806 | $33,209 |
| 2016 | $4,685 | $42,339 | $13,771 | $28,568 |
| 2015 | $4,453 | $35,980 | $14,408 | $21,572 |
| 2014 | $3,820 | $35,980 | $14,408 | $21,572 |
Source: Public Records
Map
Nearby Homes
- 1057 Rand Way
- 1077 Rand Way
- 954 Lasalle St
- 1009 Monarch Way
- 877 Eldorado Dr
- 1302 Eldorado Dr
- 1322 Eldorado Dr
- 977 Eldorado Dr
- 882 Eldorado Dr
- 1986 Estabrook Way
- 683 Eaton Cir
- 2280 Clayton Cir
- 743 Eaton Cir
- 1244 S Weldona Ln
- 1125 Stoneham St
- 1220 S Boyero Ct
- 1815 Spaulding Cir Unit 1815
- 2142 Concord Ln Unit 10
- 2241 Dailey St
- 390 Andrew Way
Your Personal Tour Guide
Ask me questions while you tour the home.