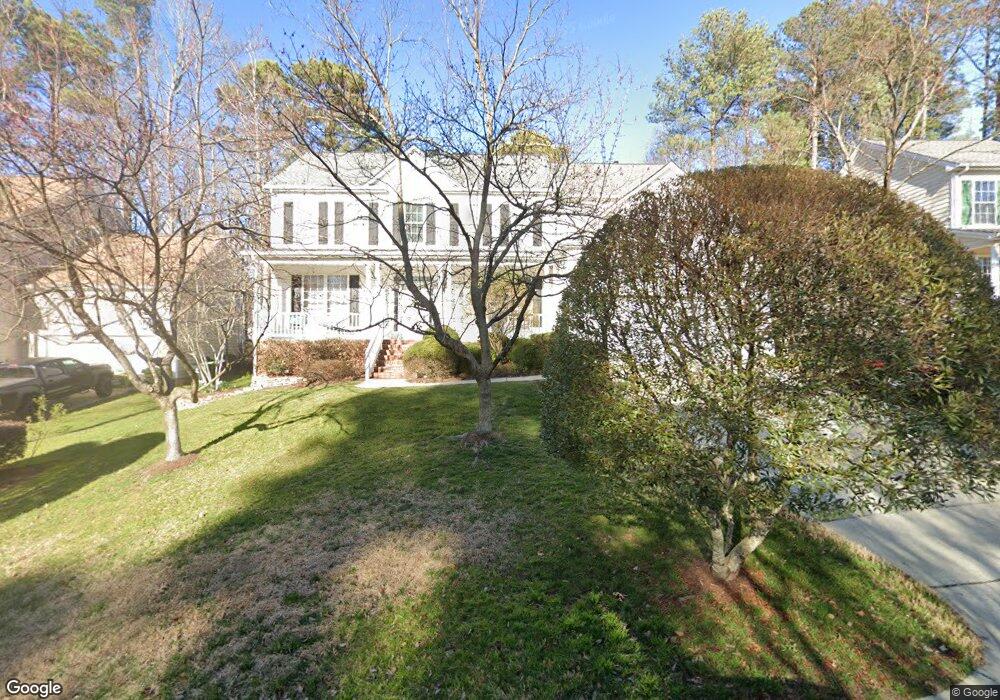
1904 Dunwick Ct Apex, NC 27523
Beaver Creek NeighborhoodEstimated Value: $658,000 - $695,928
4
Beds
3
Baths
2,950
Sq Ft
$231/Sq Ft
Est. Value
About This Home
This home is located at 1904 Dunwick Ct, Apex, NC 27523 and is currently estimated at $679,982, approximately $230 per square foot. 1904 Dunwick Ct is a home located in Wake County with nearby schools including Turner Creek Elementary School, Salem Middle, and Green Level High School.
Ownership History
Date
Name
Owned For
Owner Type
Purchase Details
Closed on
Mar 18, 2003
Sold by
Benedict Brett and Benedict Lynda
Bought by
Duncan George L and Duncan Joanne R
Current Estimated Value
Home Financials for this Owner
Home Financials are based on the most recent Mortgage that was taken out on this home.
Original Mortgage
$190,000
Interest Rate
5.17%
Mortgage Type
Purchase Money Mortgage
Purchase Details
Closed on
Jan 30, 1998
Sold by
Pulte Home Corp
Bought by
Benedict Brett and Benedict Lynda
Home Financials for this Owner
Home Financials are based on the most recent Mortgage that was taken out on this home.
Original Mortgage
$135,000
Interest Rate
7.01%
Create a Home Valuation Report for This Property
The Home Valuation Report is an in-depth analysis detailing your home's value as well as a comparison with similar homes in the area
Home Values in the Area
Average Home Value in this Area
Purchase History
| Date | Buyer | Sale Price | Title Company |
|---|---|---|---|
| Duncan George L | $238,000 | -- | |
| Benedict Brett | $205,500 | -- |
Source: Public Records
Mortgage History
| Date | Status | Borrower | Loan Amount |
|---|---|---|---|
| Previous Owner | Duncan George L | $190,000 | |
| Previous Owner | Benedict Brett | $135,000 |
Source: Public Records
Tax History Compared to Growth
Tax History
| Year | Tax Paid | Tax Assessment Tax Assessment Total Assessment is a certain percentage of the fair market value that is determined by local assessors to be the total taxable value of land and additions on the property. | Land | Improvement |
|---|---|---|---|---|
| 2025 | $5,745 | $655,665 | $220,000 | $435,665 |
| 2024 | $5,616 | $655,665 | $220,000 | $435,665 |
| 2023 | $4,489 | $407,348 | $85,000 | $322,348 |
| 2022 | $4,214 | $407,348 | $85,000 | $322,348 |
| 2021 | $4,053 | $407,348 | $85,000 | $322,348 |
| 2020 | $4,012 | $407,348 | $85,000 | $322,348 |
| 2019 | $3,841 | $336,463 | $85,000 | $251,463 |
| 2018 | $3,618 | $336,463 | $85,000 | $251,463 |
| 2017 | $3,368 | $336,463 | $85,000 | $251,463 |
| 2016 | $3,236 | $328,046 | $85,000 | $243,046 |
| 2015 | $3,161 | $312,688 | $67,000 | $245,688 |
| 2014 | $3,047 | $312,688 | $67,000 | $245,688 |
Source: Public Records
Map
Nearby Homes
- 2314 Colony Woods Dr
- 2317 Colony Woods Dr
- 772 Mirkwood Ave
- 2414 Bristers Spring Way
- 2321 Walden Creek Dr
- 2004 Clydner Dr
- 1505 Poets Glade Dr
- 2101 White Pond Ct
- 2120 Grouse Ski Cir
- 1705 Pointe Crossing
- 2123 Grouse Ski Cir
- 479 Clark Creek Ln
- 763 Larkspur Bowl Way
- 2106 Grubstake St
- 760 Bachelor Gulch Way
- 2124 Grubstake St
- 755 Bachelor Gulch Way
- Nolen Plan at Prestwick
- Hutton Plan at Prestwick
- Continental Plan at Prestwick
- 1904 Dunwick Ct
- 1902 Dunwick Ct
- 1906 Dunwick Ct
- 1907 Steam Ridge Ct
- 1903 Dunwick Ct
- 2306 Colony Woods Dr
- 1903 Dunwick Ct
- 1905 Dunwick Ct
- 1908 Dunwick Ct
- 1903 Steam Ridge Ct
- 2304 Colony Woods Dr
- 1907 Dunwick Ct
- 1909 Dunwick Ct
- 2310 Colony Woods Dr
- 1907 Dunwick Ct
- 1908 Steam Ridge Ct
- 2302 Colony Woods Dr
- 1903 N Dunwick Ct
- 1907 N Dunwick Ct
- 2312 Colony Woods Dr