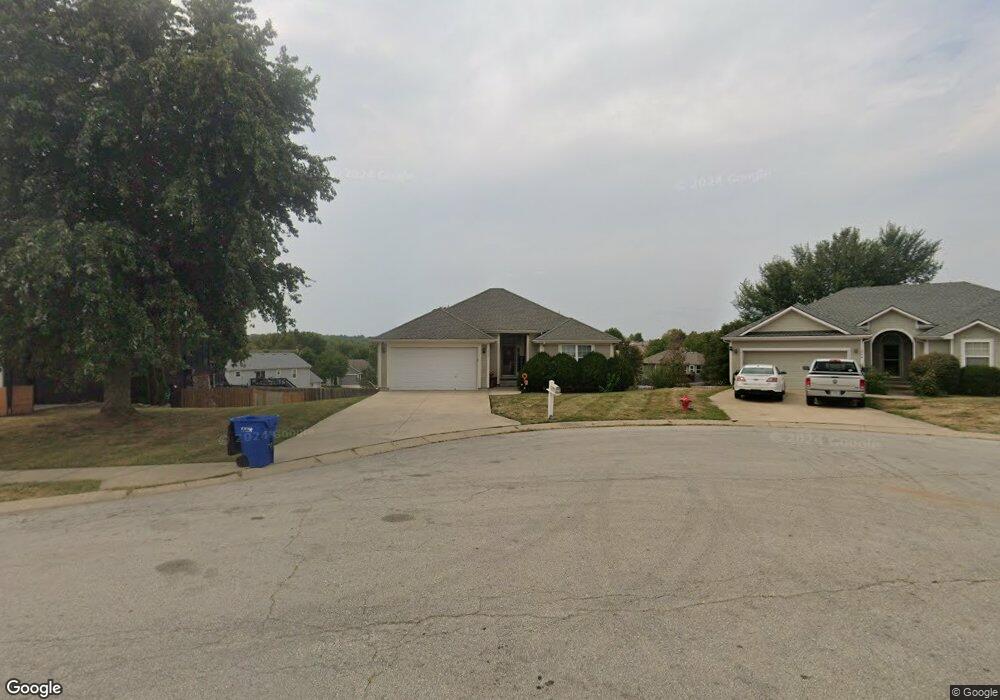
1904 NW Hackberry Ct Grain Valley, MO 64029
Estimated Value: $362,000 - $391,028
3
Beds
2
Baths
1,525
Sq Ft
$246/Sq Ft
Est. Value
About This Home
This home is located at 1904 NW Hackberry Ct, Grain Valley, MO 64029 and is currently estimated at $374,757, approximately $245 per square foot. 1904 NW Hackberry Ct is a home located in Jackson County with nearby schools including Grain Valley High School and St John Lalande School.
Ownership History
Date
Name
Owned For
Owner Type
Purchase Details
Closed on
Aug 5, 2019
Sold by
Frazier Michael A and Frazier Shelly D
Bought by
Frazier Dawn L and Frazier James A
Current Estimated Value
Home Financials for this Owner
Home Financials are based on the most recent Mortgage that was taken out on this home.
Original Mortgage
$177,452
Outstanding Balance
$155,733
Interest Rate
3.8%
Mortgage Type
FHA
Estimated Equity
$219,024
Purchase Details
Closed on
May 31, 2007
Sold by
Kidd Lynette J
Bought by
Frazier Michael A and Frazier Shelly D
Purchase Details
Closed on
May 5, 2004
Sold by
Kidd Lynette J
Bought by
Kidd Lynette J and Lynette J Kidd Revocable Trust
Purchase Details
Closed on
Feb 28, 2003
Sold by
Ancona Construction Inc
Bought by
Kidd Lynette J
Home Financials for this Owner
Home Financials are based on the most recent Mortgage that was taken out on this home.
Original Mortgage
$125,456
Interest Rate
5.57%
Mortgage Type
Purchase Money Mortgage
Create a Home Valuation Report for This Property
The Home Valuation Report is an in-depth analysis detailing your home's value as well as a comparison with similar homes in the area
Home Values in the Area
Average Home Value in this Area
Purchase History
| Date | Buyer | Sale Price | Title Company |
|---|---|---|---|
| Frazier Dawn L | -- | Security 1St Title | |
| Frazier Michael A | $220,000 | Metro One Title | |
| Kidd Lynette J | -- | -- | |
| Kidd Lynette J | -- | Ctic |
Source: Public Records
Mortgage History
| Date | Status | Borrower | Loan Amount |
|---|---|---|---|
| Open | Frazier Dawn L | $177,452 | |
| Previous Owner | Kidd Lynette J | $125,456 | |
| Closed | Kidd Lynette J | $23,523 |
Source: Public Records
Tax History Compared to Growth
Tax History
| Year | Tax Paid | Tax Assessment Tax Assessment Total Assessment is a certain percentage of the fair market value that is determined by local assessors to be the total taxable value of land and additions on the property. | Land | Improvement |
|---|---|---|---|---|
| 2025 | $5,469 | $58,043 | $9,515 | $48,528 |
| 2024 | $5,265 | $66,403 | $9,857 | $56,546 |
| 2023 | $5,265 | $66,403 | $10,765 | $55,638 |
| 2022 | $3,979 | $43,890 | $5,164 | $38,726 |
| 2021 | $3,886 | $43,890 | $5,164 | $38,726 |
| 2020 | $3,440 | $38,326 | $5,164 | $33,162 |
| 2019 | $3,370 | $38,326 | $5,164 | $33,162 |
| 2018 | $1,558,026 | $33,356 | $4,494 | $28,862 |
| 2017 | $2,818 | $33,356 | $4,494 | $28,862 |
| 2016 | $2,818 | $29,963 | $4,731 | $25,232 |
| 2014 | $2,530 | $26,701 | $4,822 | $21,879 |
Source: Public Records
Map
Nearby Homes
- 952 NW Maplewood Ct
- 1103 NW Hickory Ct
- 809 NW Poplar Ct
- 2003 NW Elmwood Dr
- 816 NW Cedar Ln
- 408 NW Rust Ct
- 1702 NW Hedgewood Dr
- 1310 NW Sycamore Dr
- 1800 NW Mya Ct
- 2211 NW Hedgewood Dr
- 401 NW Europa Dr
- 1515 NW Whispering Ct
- TBD E Duncan Rd
- 912 NW Hickorywood Dr
- 801 NW Hickory Ridge Dr
- 803 NW Hickory Ridge Dr
- 1601 NW Nicholas Dr
- 1401 NW Hickory Ridge Ct
- 1403 NW Burr Oak Ct
- 505 NW Whitney Dr
- 1906 NW Hackberry Ct
- 1902 NW Hackberry Ct
- 957 NW Maplewood Ct
- 966 NW Redbud Dr
- 968 NW Redbud Dr
- 1907 NW Hackberry Ct
- 955 NW Maplewood Ct
- 959 NW Maplewood Ct
- 961 NW Maplewood Ct
- 1905 NW Hackberry Ct
- 969 NW Maplewood Ct
- 905 NW Redbud Dr
- 903 NW Redbud Dr
- 902 NW Redbud Dr
- 1903 NW Hackberry Ct
- 967 NW Redbud Dr
- 901 NW Redbud Dr
- 960 NW Maplewood Ct
- 962 NW Maplewood Ct
- 951 NW Maplewood Ct