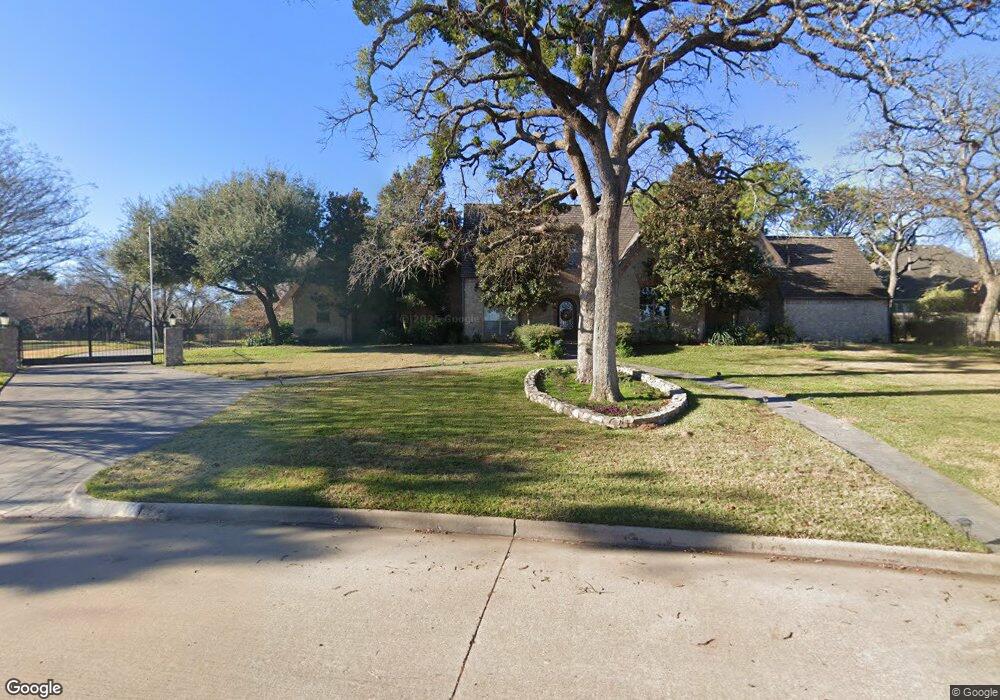
1904 Ptarmigan St Southlake, TX 76092
Estimated Value: $1,994,000 - $2,406,000
5
Beds
6
Baths
6,070
Sq Ft
$355/Sq Ft
Est. Value
About This Home
This home is located at 1904 Ptarmigan St, Southlake, TX 76092 and is currently estimated at $2,154,375, approximately $354 per square foot. 1904 Ptarmigan St is a home located in Tarrant County with nearby schools including Walnut Grove Elementary School, Don T. Durham Intermediate School, and Carroll Middle School.
Ownership History
Date
Name
Owned For
Owner Type
Purchase Details
Closed on
Aug 20, 2016
Sold by
Erne Jennifer
Bought by
Panter David
Current Estimated Value
Purchase Details
Closed on
Nov 18, 2014
Sold by
Fox Karen
Bought by
Panter David and Erne Jennifer
Purchase Details
Closed on
Sep 15, 2011
Sold by
Bell Melanie Kay and Lorant Melanie
Bought by
Karen A Fox 2001 Living Trust
Home Financials for this Owner
Home Financials are based on the most recent Mortgage that was taken out on this home.
Original Mortgage
$800,000
Interest Rate
4.43%
Mortgage Type
New Conventional
Purchase Details
Closed on
Dec 12, 2000
Sold by
Chateau Classic Homes Inc
Bought by
Bell Melanie Kay
Home Financials for this Owner
Home Financials are based on the most recent Mortgage that was taken out on this home.
Original Mortgage
$749,000
Interest Rate
7.62%
Create a Home Valuation Report for This Property
The Home Valuation Report is an in-depth analysis detailing your home's value as well as a comparison with similar homes in the area
Home Values in the Area
Average Home Value in this Area
Purchase History
| Date | Buyer | Sale Price | Title Company |
|---|---|---|---|
| Panter David | -- | None Available | |
| Panter David | -- | None Available | |
| Karen A Fox 2001 Living Trust | -- | Reunion Title | |
| Bell Melanie Kay | -- | First American Title Co |
Source: Public Records
Mortgage History
| Date | Status | Borrower | Loan Amount |
|---|---|---|---|
| Previous Owner | Karen A Fox 2001 Living Trust | $800,000 | |
| Previous Owner | Bell Melanie Kay | $749,000 |
Source: Public Records
Tax History Compared to Growth
Tax History
| Year | Tax Paid | Tax Assessment Tax Assessment Total Assessment is a certain percentage of the fair market value that is determined by local assessors to be the total taxable value of land and additions on the property. | Land | Improvement |
|---|---|---|---|---|
| 2025 | $18,686 | $1,523,275 | $637,920 | $885,355 |
| 2024 | $18,686 | $1,675,602 | $637,920 | $1,037,682 |
| 2023 | $20,185 | $1,602,005 | $637,920 | $964,085 |
| 2022 | $21,720 | $1,006,779 | $469,100 | $537,679 |
| 2021 | $23,664 | $1,037,916 | $469,100 | $568,816 |
| 2020 | $23,858 | $1,037,916 | $525,280 | $512,636 |
| 2019 | $27,699 | $1,143,888 | $525,280 | $618,608 |
| 2018 | $27,511 | $1,194,477 | $525,280 | $669,197 |
| 2017 | $37,591 | $1,516,624 | $325,280 | $1,191,344 |
| 2016 | $28,504 | $1,150,000 | $325,779 | $824,221 |
| 2015 | $19,926 | $981,100 | $112,500 | $868,600 |
| 2014 | $19,926 | $981,100 | $112,500 | $868,600 |
Source: Public Records
Map
Nearby Homes
- 1600 Enclave Ct
- 1161 La Mirada
- 1633 Mockingbird Ln
- 1567 Dove Rd
- 1425 N Peytonville Ave
- 1720 Maranatha Way
- 1502 Bluffview Dr
- 1705 Maranatha Way
- 1711 Maranatha Way
- 1820 Beam Dr
- 935 W Dove Rd
- 1052 W Dove Rd
- 1521 Meandering Way Dr
- 1805 Leeds Dr
- 1847 Broken Bend Dr
- 1371 Holland Hill
- 1403 Fountain Grass Ct
- 1121 Post Oak Place
- 1609 Meandering Way Dr
- 1402 Thetford Ct
- 1701 Tuscan Ridge Cir
- 1705 Tuscan Ridge Cir
- 1661 Tuscan Ridge Cir
- 1709 Tuscan Ridge Cir
- 1657 Tuscan Ridge Cir
- 1903 Ptarmigan St
- 1710 Tuscan Ridge Cir
- 1613 Regal Oaks Dr
- 1648 Tuscan Ridge Cir
- 1713 Tuscan Ridge Cir
- 1653 Tuscan Ridge Cir
- 1611 Regal Oaks Dr
- 1714 Tuscan Ridge Cir
- 1644 Tuscan Ridge Cir
- 1717 Tuscan Ridge Cir
- 1502 Plantation Dr
- 1649 Tuscan Ridge Cir
- 1905 Ptarmigan St
- 1718 Tuscan Ridge Cir
- 1640 Tuscan Ridge Cir