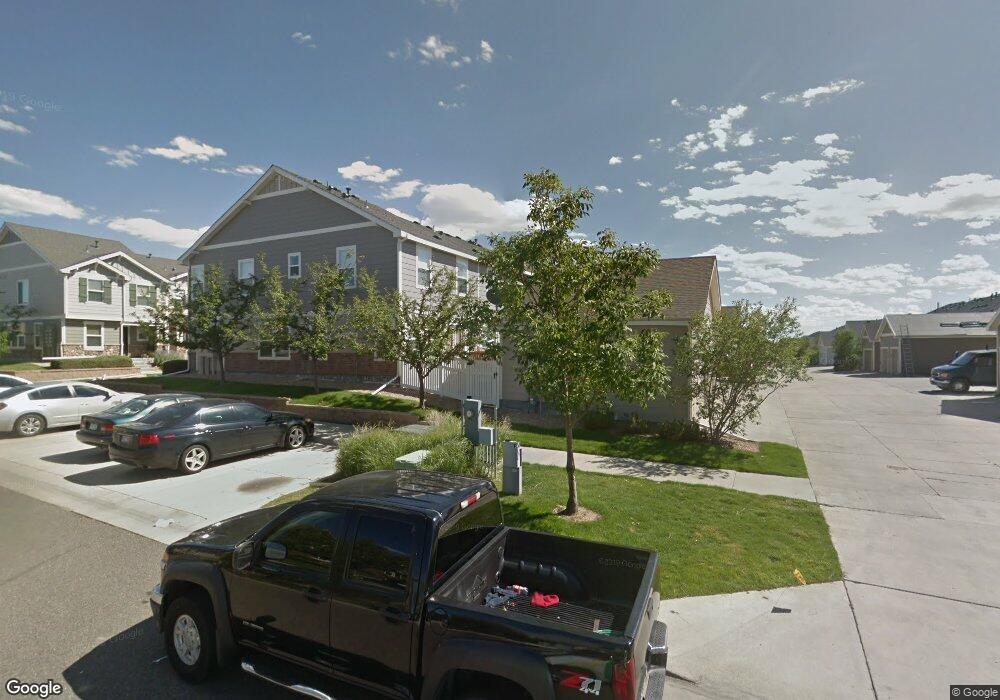
19041 E 58th Ave Denver, CO 80249
Estimated Value: $363,714 - $388,000
3
Beds
3
Baths
1,526
Sq Ft
$247/Sq Ft
Est. Value
About This Home
This home is located at 19041 E 58th Ave, Denver, CO 80249 and is currently estimated at $376,679, approximately $246 per square foot. 19041 E 58th Ave is a home located in Denver County with nearby schools including Pitt-Waller K-8 School, McGlone Academy, and Marie L. Greenwood Academy.
Ownership History
Date
Name
Owned For
Owner Type
Purchase Details
Closed on
Nov 30, 2017
Sold by
Hernandez Jaime
Bought by
Djigo Alssata and Diop Pape
Current Estimated Value
Home Financials for this Owner
Home Financials are based on the most recent Mortgage that was taken out on this home.
Original Mortgage
$258,236
Outstanding Balance
$220,551
Interest Rate
4.87%
Mortgage Type
FHA
Estimated Equity
$156,128
Purchase Details
Closed on
Jan 30, 2015
Sold by
Titus Peter
Bought by
Hernandez Jaime
Home Financials for this Owner
Home Financials are based on the most recent Mortgage that was taken out on this home.
Original Mortgage
$168,780
Interest Rate
3.89%
Mortgage Type
New Conventional
Purchase Details
Closed on
Nov 26, 2007
Sold by
Kb Home Colorado Inc
Bought by
Titus Peter
Home Financials for this Owner
Home Financials are based on the most recent Mortgage that was taken out on this home.
Original Mortgage
$127,986
Interest Rate
6.3%
Mortgage Type
FHA
Create a Home Valuation Report for This Property
The Home Valuation Report is an in-depth analysis detailing your home's value as well as a comparison with similar homes in the area
Purchase History
| Date | Buyer | Sale Price | Title Company |
|---|---|---|---|
| Djigo Alssata | $263,000 | Heritage Title Co | |
| Hernandez Jaime | $174,000 | Assured Title | |
| Titus Peter | $129,995 | Security Title |
Source: Public Records
Mortgage History
| Date | Status | Borrower | Loan Amount |
|---|---|---|---|
| Open | Djigo Alssata | $258,236 | |
| Previous Owner | Hernandez Jaime | $168,780 | |
| Previous Owner | Titus Peter | $127,986 |
Source: Public Records
Tax History
| Year | Tax Paid | Tax Assessment Tax Assessment Total Assessment is a certain percentage of the fair market value that is determined by local assessors to be the total taxable value of land and additions on the property. | Land | Improvement |
|---|---|---|---|---|
| 2025 | $1,996 | $25,400 | $1,970 | $1,970 |
| 2024 | $1,996 | $21,100 | $1,880 | $19,220 |
| 2023 | $1,973 | $21,100 | $1,880 | $19,220 |
| 2022 | $1,884 | $19,720 | $2,060 | $17,660 |
| 2021 | $1,839 | $20,290 | $2,120 | $18,170 |
| 2020 | $1,651 | $18,310 | $2,120 | $16,190 |
| 2019 | $1,613 | $18,310 | $2,120 | $16,190 |
| 2018 | $1,349 | $14,450 | $1,780 | $12,670 |
| 2017 | $1,346 | $14,450 | $1,780 | $12,670 |
| 2016 | $1,054 | $10,810 | $653 | $10,157 |
| 2015 | $1,018 | $10,810 | $653 | $10,157 |
| 2014 | $797 | $8,050 | $637 | $7,413 |
Source: Public Records
Map
Nearby Homes
- 18769 E 58th Ave Unit E
- 5811 Ceylon St
- 5888 Biscay St Unit D
- 5888 Biscay St Unit B
- 19047 E 57th Place
- 5850 Ceylon St Unit D
- 19037 E 57th Place
- 18947 E 57th Place
- 18986 E 57th Place Unit A
- 5800 Tower Rd Unit 2411
- 5800 Tower Rd Unit 406
- 5800 Tower Rd Unit 505
- 5800 Tower Rd Unit 1301
- 19558 E 58th Cir
- 19681 E 59th Place
- 18977 Randolph Place
- 6153 N Ceylon St Unit 108
- 6153 N Ceylon St Unit 9204
- 6153 N Ceylon St Unit 307
- 6153 N Ceylon St Unit Bldg 4
- 19039 E 58th Ave
- 19033 E 58th Ave
- 19049 E 58th Ave
- 19031 E 58th Ave
- 19059 E 58th Ave
- 19061 E 58th Ave
- 19053 E 58th Ave
- 19023 E 58th Ave
- 19063 E 58th Ave
- 5870 Ceylon St Unit D
- 5870 Ceylon St Unit A
- 5870 Ceylon St Unit F
- 5870 Ceylon St Unit E
- 5870 Ceylon St Unit C
- 5870 Ceylon St Unit B
- 5870 Ceylon St Unit B-107
- 5870 Ceylon St Unit C-108
- 19051 E 58th Ave
- 19069 E 58th Ave
- 19071 E 58th Ave
Your Personal Tour Guide
Ask me questions while you tour the home.