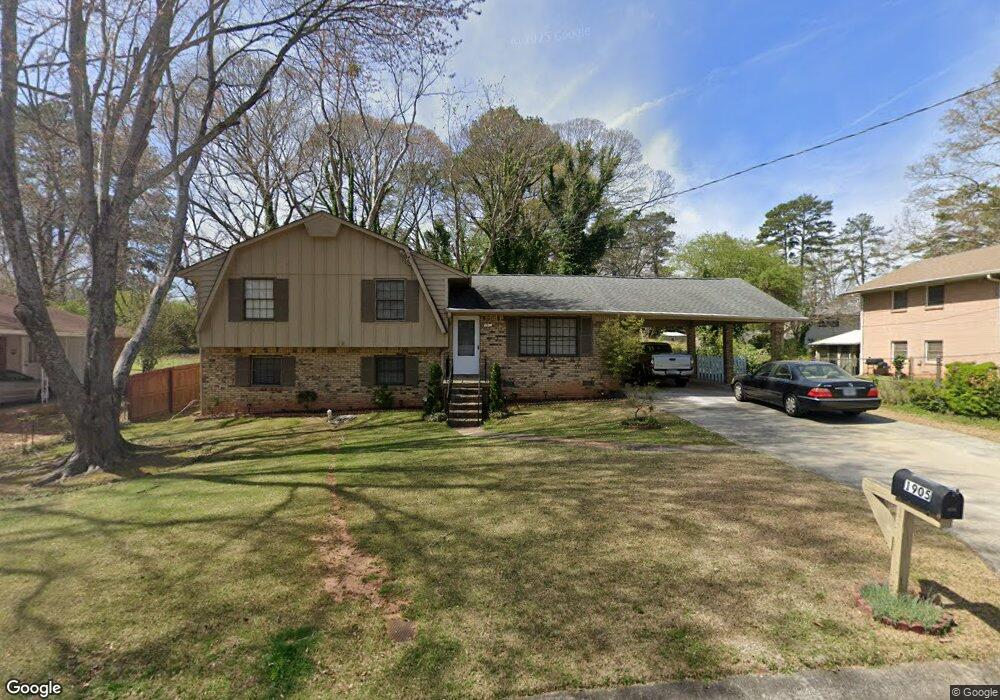
1905 Argonne Dr Morrow, GA 30260
Estimated Value: $213,202 - $256,000
3
Beds
3
Baths
1,624
Sq Ft
$144/Sq Ft
Est. Value
About This Home
This home is located at 1905 Argonne Dr, Morrow, GA 30260 and is currently estimated at $234,051, approximately $144 per square foot. 1905 Argonne Dr is a home located in Clayton County with nearby schools including Morrow Elementary School, Morrow Middle School, and Morrow High School.
Ownership History
Date
Name
Owned For
Owner Type
Purchase Details
Closed on
Jun 11, 2018
Sold by
Nguyen Hong Tham Thi
Bought by
Nguyen Bang D and Nguyen Xuan Mail T
Current Estimated Value
Purchase Details
Closed on
Oct 3, 2011
Sold by
Secretary Of Housing And U
Bought by
Nguyen Hong Tham Thi
Purchase Details
Closed on
Feb 1, 2011
Sold by
Citimortgage
Bought by
Hud-Housing Of Urban Dev
Purchase Details
Closed on
Sep 19, 2007
Sold by
Clark Thomas A and Clark Doren L
Bought by
Baugh Edmund J and Bowers Selena
Home Financials for this Owner
Home Financials are based on the most recent Mortgage that was taken out on this home.
Original Mortgage
$133,941
Interest Rate
6.57%
Mortgage Type
FHA
Purchase Details
Closed on
Nov 2, 1998
Sold by
Huffaker Chris B and Huffaker Lisa W
Bought by
Nieves Pedro J
Home Financials for this Owner
Home Financials are based on the most recent Mortgage that was taken out on this home.
Original Mortgage
$77,838
Interest Rate
6.65%
Mortgage Type
FHA
Create a Home Valuation Report for This Property
The Home Valuation Report is an in-depth analysis detailing your home's value as well as a comparison with similar homes in the area
Home Values in the Area
Average Home Value in this Area
Purchase History
| Date | Buyer | Sale Price | Title Company |
|---|---|---|---|
| Nguyen Bang D | -- | -- | |
| Nguyen Hong Tham Thi | $34,500 | -- | |
| Hud-Housing Of Urban Dev | -- | -- | |
| Citimortgage | $164,254 | -- | |
| Baugh Edmund J | $135,000 | -- | |
| Nieves Pedro J | $80,000 | -- |
Source: Public Records
Mortgage History
| Date | Status | Borrower | Loan Amount |
|---|---|---|---|
| Previous Owner | Baugh Edmund J | $133,941 | |
| Previous Owner | Nieves Pedro J | $77,838 |
Source: Public Records
Tax History Compared to Growth
Tax History
| Year | Tax Paid | Tax Assessment Tax Assessment Total Assessment is a certain percentage of the fair market value that is determined by local assessors to be the total taxable value of land and additions on the property. | Land | Improvement |
|---|---|---|---|---|
| 2024 | $3,030 | $77,680 | $7,200 | $70,480 |
| 2023 | $2,613 | $72,360 | $7,200 | $65,160 |
| 2022 | $2,133 | $54,360 | $7,200 | $47,160 |
| 2021 | $1,592 | $40,320 | $7,200 | $33,120 |
| 2020 | $1,465 | $36,619 | $7,200 | $29,419 |
| 2019 | $1,618 | $39,852 | $6,400 | $33,452 |
| 2018 | $1,697 | $41,792 | $6,400 | $35,392 |
| 2017 | $1,527 | $37,534 | $6,400 | $31,134 |
| 2016 | $1,312 | $32,235 | $6,400 | $25,835 |
| 2015 | $880 | $0 | $0 | $0 |
| 2014 | $875 | $22,000 | $6,400 | $15,600 |
Source: Public Records
Map
Nearby Homes
- 6553 Meadowbrook Ln
- 6663 Peacock Blvd
- 1804 Carla Dr
- The Rose Interior Plan at Sonata
- The Azalea Interior Plan at Sonata
- The Rose Exterior Plan at Sonata
- The Lily Interior Plan at Sonata
- The Daisy Exterior Plan at Sonata
- 6461 Northridge Way
- 2117 Amish Ct
- 6495 Revena Dr
- 6446 Oakleaf Way
- 6430 Oakleaf Way
- 6411 Northridge Dr Unit 6411
- 1902 Mural Cir Unit 5
- 6627 Cameron Rd
- 2203 Willoby Ct Unit 2
- 2217 Willoby Ct
- 6605 Demere Dr Unit 3
- 6172 Princeton Ave Unit 6
- 1909 Argonne Dr
- 1909 Argonne Dr
- 1909 Argonne Dr
- 1909 Argonne Dr
- 1901 Pershing Way
- 1849 Pershing Way
- 6556 Wendell Cir
- 1913 Argonne Dr
- 6548 Wendell Cir
- 1906 Argonne Dr
- 1910 Argonne Dr
- 1843 Pershing Way
- 1902 Argonne Dr
- 6564 Wendell Cir
- 1914 Argonne Dr
- 1898 Argonne Dr
- 1921 Argonne Dr
- 6349 Wendell Cir
- 1860 Wendell Way
- 1860 Pershing Way