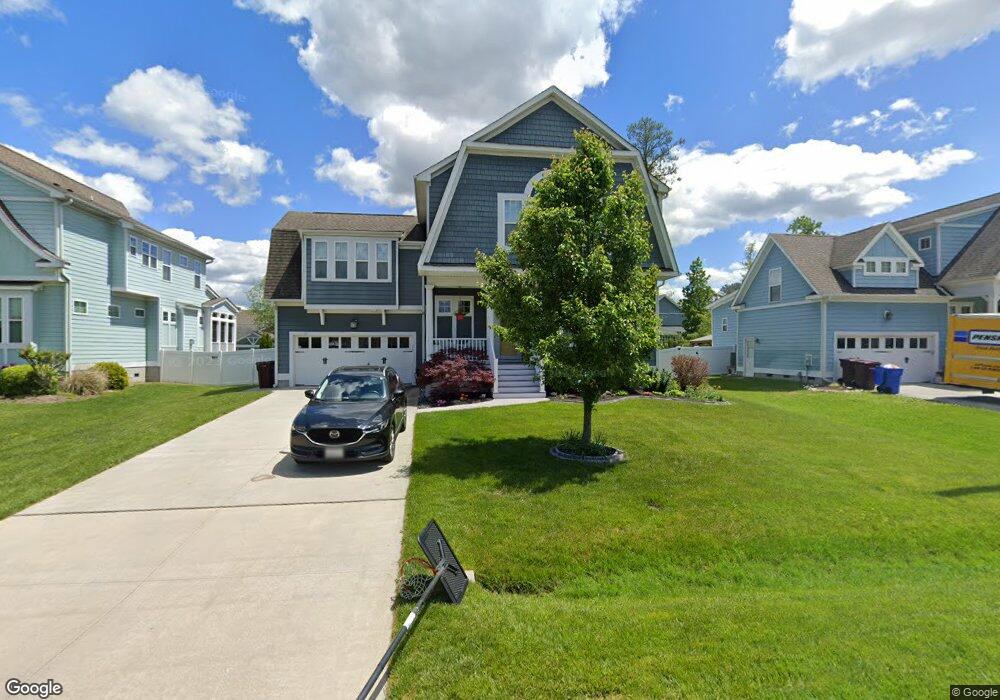
1905 Flintshire Dr Chesapeake, VA 23323
Deep Creek NeighborhoodEstimated Value: $640,000 - $680,000
5
Beds
3
Baths
2,938
Sq Ft
$225/Sq Ft
Est. Value
About This Home
This home is located at 1905 Flintshire Dr, Chesapeake, VA 23323 and is currently estimated at $659,942, approximately $224 per square foot. 1905 Flintshire Dr is a home located in Chesapeake City with nearby schools including Grassfield Elementary School, Hugo a Owens Middle, and Grassfield High School.
Ownership History
Date
Name
Owned For
Owner Type
Purchase Details
Closed on
Dec 15, 2015
Sold by
Cowan Shawn M and Singer Sheila M
Bought by
Brown Travis J and Brown Amber N
Current Estimated Value
Home Financials for this Owner
Home Financials are based on the most recent Mortgage that was taken out on this home.
Original Mortgage
$403,750
Outstanding Balance
$319,510
Interest Rate
3.89%
Mortgage Type
New Conventional
Estimated Equity
$340,432
Purchase Details
Closed on
Apr 12, 2014
Sold by
Stephen Alexander Homes Llc
Bought by
Cowan Shawn M
Home Financials for this Owner
Home Financials are based on the most recent Mortgage that was taken out on this home.
Original Mortgage
$426,210
Interest Rate
4.37%
Mortgage Type
VA
Purchase Details
Closed on
Dec 4, 2013
Sold by
Stephen Alexander Homes Two
Bought by
Stephen Alexander Homes Llc
Purchase Details
Closed on
Dec 16, 2004
Sold by
Norwood Margaret
Bought by
Stephen Alexander Homes Two
Create a Home Valuation Report for This Property
The Home Valuation Report is an in-depth analysis detailing your home's value as well as a comparison with similar homes in the area
Home Values in the Area
Average Home Value in this Area
Purchase History
| Date | Buyer | Sale Price | Title Company |
|---|---|---|---|
| Brown Travis J | $425,000 | Advance Title & Abstract | |
| Cowan Shawn M | $427,240 | -- | |
| Stephen Alexander Homes Llc | $80,000 | -- | |
| Stephen Alexander Homes Two | $125,000 | -- |
Source: Public Records
Mortgage History
| Date | Status | Borrower | Loan Amount |
|---|---|---|---|
| Open | Brown Travis J | $403,750 | |
| Previous Owner | Cowan Shawn M | $426,210 |
Source: Public Records
Tax History Compared to Growth
Tax History
| Year | Tax Paid | Tax Assessment Tax Assessment Total Assessment is a certain percentage of the fair market value that is determined by local assessors to be the total taxable value of land and additions on the property. | Land | Improvement |
|---|---|---|---|---|
| 2025 | $5,924 | $638,100 | $190,000 | $448,100 |
| 2024 | $5,924 | $586,500 | $175,000 | $411,500 |
| 2023 | $5,288 | $572,300 | $145,000 | $427,300 |
| 2022 | $5,340 | $528,700 | $135,000 | $393,700 |
| 2021 | $4,691 | $446,800 | $110,000 | $336,800 |
| 2020 | $4,551 | $433,400 | $105,000 | $328,400 |
| 2019 | $4,444 | $423,200 | $105,000 | $318,200 |
| 2018 | $4,379 | $407,400 | $95,000 | $312,400 |
| 2017 | $4,266 | $406,300 | $105,000 | $301,300 |
| 2016 | $4,330 | $412,400 | $100,000 | $312,400 |
| 2015 | $4,278 | $407,400 | $95,000 | $312,400 |
| 2014 | $4,138 | $394,100 | $90,000 | $304,100 |
Source: Public Records
Map
Nearby Homes
- 1725 Burson Dr
- 1860 Millville Rd
- 1908 Mccoy Rd
- 1916 Mccoy Rd
- 1653 Shipyard Rd
- 1917 Mccoy Rd
- 1918 Mccoy Rd
- 1949 Lemonwood Rd
- 1949 Rockwood Dr
- 2014 Millville Rd
- 2219 Angler Ln
- 1758 Watershed Ct
- 2001 Kelsey Bay Ct
- 2000 Kelsey Bay Ct
- 1808 Aft Way
- 2084 Millville Rd
- 1857 Shipyard Rd
- 900 Gabion Way
- 918 Parley Place
- 2029 Shipyard Rd
- 1901 Flintshire Dr
- 1909 Flintshire Dr
- 1913 Flintshire Dr
- 1806 Hazelwood Rd
- 1805 Rockwood Dr
- 1808 Hazelwood Rd
- 1900 Flintshire Dr
- 1908 Flintshire Dr
- 1820 Rockwood Dr
- 1917 Flintshire Dr
- 1810 Hazelwood Rd
- 1804 Rockwood Dr
- 1812 Rockwood Dr
- 1912 Flintshire Dr
- 1808 Rockwood Dr
- 1824 Rockwood Dr
- 1812 Hazelwood Rd
- 1916 Flintshire Dr
- 1828 Rockwood Dr
- 1805 Hazelwood Rd