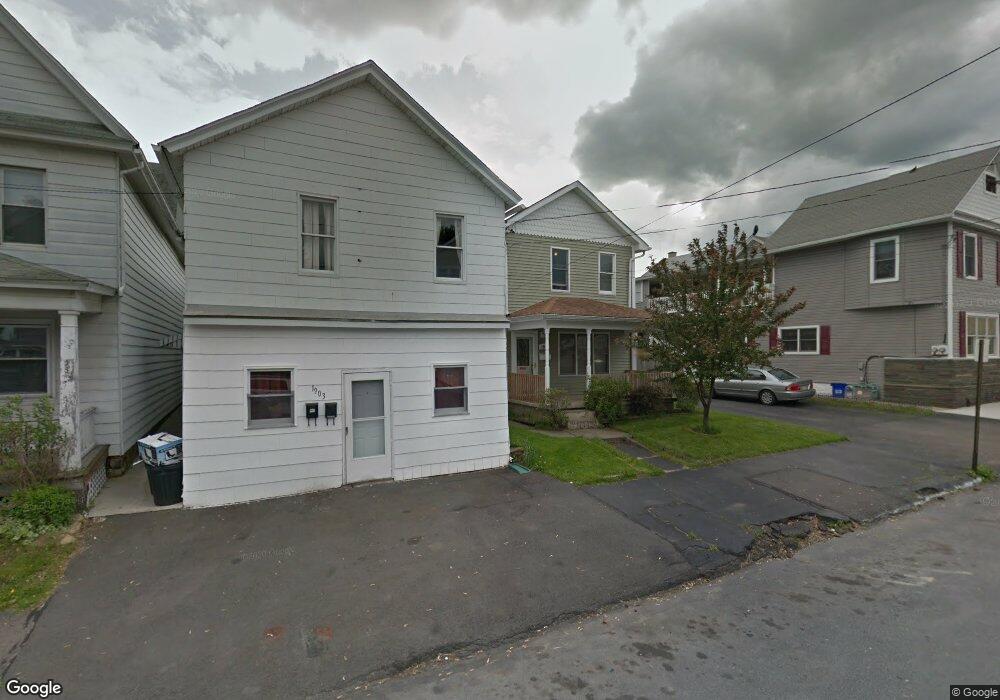
1905 Jackson St Scranton, PA 18504
Hyde Park NeighborhoodEstimated Value: $158,000 - $198,000
3
Beds
1
Bath
1,828
Sq Ft
$95/Sq Ft
Est. Value
About This Home
This home is located at 1905 Jackson St, Scranton, PA 18504 and is currently estimated at $173,460, approximately $94 per square foot. 1905 Jackson St is a home located in Lackawanna County with nearby schools including Isaac Tripp Elementary School, West Scranton Intrmd School, and West Scranton High School.
Ownership History
Date
Name
Owned For
Owner Type
Purchase Details
Closed on
Sep 25, 2020
Sold by
Mills Amy M
Bought by
Mills Amy M and Mills Eric M
Current Estimated Value
Home Financials for this Owner
Home Financials are based on the most recent Mortgage that was taken out on this home.
Original Mortgage
$95,000
Outstanding Balance
$68,280
Interest Rate
2.9%
Mortgage Type
New Conventional
Estimated Equity
$105,180
Purchase Details
Closed on
Jun 16, 2010
Sold by
E Properties Llc
Bought by
Mills Amy M
Home Financials for this Owner
Home Financials are based on the most recent Mortgage that was taken out on this home.
Original Mortgage
$96,105
Interest Rate
5.5%
Mortgage Type
FHA
Purchase Details
Closed on
Sep 7, 2006
Sold by
Kersavage Audrey
Bought by
Kersavage Audrey and Kersavage Kenneth
Create a Home Valuation Report for This Property
The Home Valuation Report is an in-depth analysis detailing your home's value as well as a comparison with similar homes in the area
Home Values in the Area
Average Home Value in this Area
Purchase History
| Date | Buyer | Sale Price | Title Company |
|---|---|---|---|
| Mills Amy M | -- | None Available | |
| Mills Amy M | $97,400 | None Available | |
| Kersavage Audrey | -- | None Available |
Source: Public Records
Mortgage History
| Date | Status | Borrower | Loan Amount |
|---|---|---|---|
| Open | Mills Amy M | $95,000 | |
| Previous Owner | Mills Amy M | $96,105 |
Source: Public Records
Tax History
| Year | Tax Paid | Tax Assessment Tax Assessment Total Assessment is a certain percentage of the fair market value that is determined by local assessors to be the total taxable value of land and additions on the property. | Land | Improvement |
|---|---|---|---|---|
| 2025 | $2,175 | $6,000 | $2,200 | $3,800 |
| 2024 | $2,004 | $6,000 | $2,200 | $3,800 |
| 2023 | $2,004 | $6,000 | $2,200 | $3,800 |
| 2022 | $1,961 | $6,000 | $2,200 | $3,800 |
| 2021 | $1,961 | $6,000 | $2,200 | $3,800 |
| 2020 | $1,928 | $6,000 | $2,200 | $3,800 |
| 2019 | $1,819 | $6,000 | $2,200 | $3,800 |
| 2018 | $1,819 | $6,000 | $2,200 | $3,800 |
| 2017 | $1,791 | $6,000 | $2,200 | $3,800 |
| 2016 | $704 | $6,000 | $2,200 | $3,800 |
| 2015 | $1,060 | $6,000 | $2,200 | $3,800 |
| 2014 | -- | $6,000 | $2,200 | $3,800 |
Source: Public Records
Map
Nearby Homes
- 118 N Everett Ave
- 138-140 S Everett Ave
- 142 S Van Buren Ave
- 215 N Fillmore Ave
- 217 N Fillmore Ave
- 1722 1724 Washburn St
- 1726 Washburn St Unit 1728
- 1803 Academy St
- 2133 35 Jackson St
- 2118 Washburn St
- 317 17th Ave
- 305 S Garfield Ave
- 208-210 N Lincoln Ave
- 360 N Garfield Ave
- 1413 1415 Lafayette St
- 348 N Rebecca Ave
- 219 N Sumner Ave
- 408 17th Ave Unit 410
- 405 17th Ave
- 523 N Rebecca Ave
- 1909 Jackson St
- 1903 Jackson St
- 110 S Everett Ave Unit 112
- 1901 Jackson St
- 110 S 112 Everett Ave
- 112 S Everett Ave
- 1913 Jackson St
- 114 S Everett Ave Unit 116
- 1915 Jackson St
- 118 S Everett Ave
- 117 Morris Ave
- 1910 Jackson St Unit 1914
- 110 Morris Ave
- 1906 Jackson St Unit 1908
- 1902 Jackson St
- 1914 Jackson St Unit 1916
- 1914-1916 Jackson St
- 1827 Jackson St
- 119 1/2 Morris Ave
- 112 Morris Ave
Your Personal Tour Guide
Ask me questions while you tour the home.