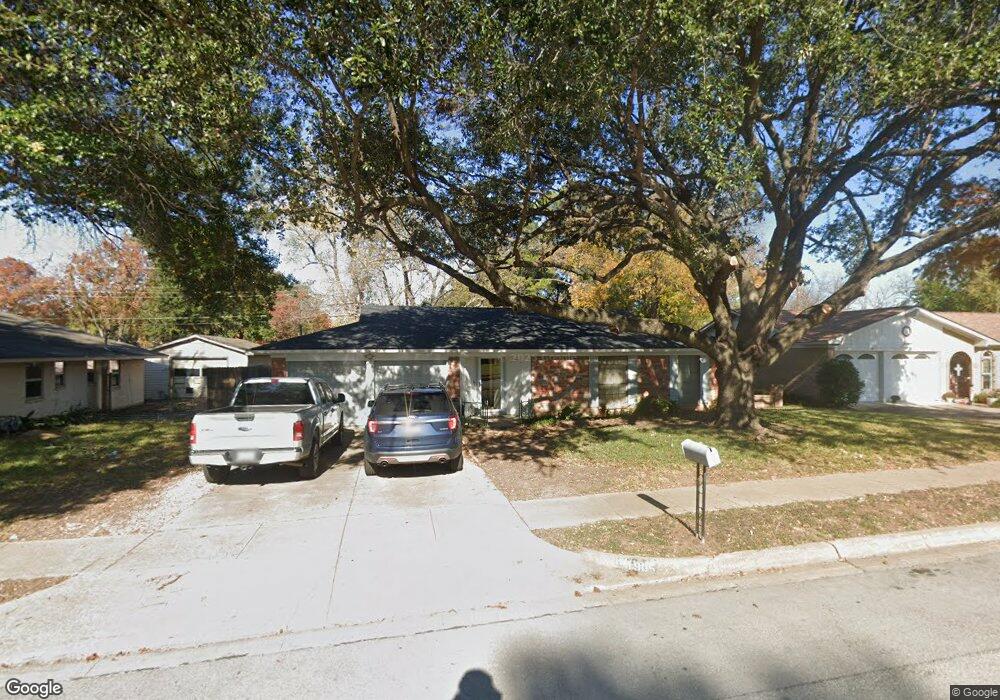
1905 Knoxville Dr Bedford, TX 76022
Estimated Value: $296,000 - $356,000
3
Beds
2
Baths
1,338
Sq Ft
$235/Sq Ft
Est. Value
About This Home
This home is located at 1905 Knoxville Dr, Bedford, TX 76022 and is currently estimated at $314,798, approximately $235 per square foot. 1905 Knoxville Dr is a home located in Tarrant County with nearby schools including Bell Manor Elementary School, Central J High School, and Trinity High School.
Ownership History
Date
Name
Owned For
Owner Type
Purchase Details
Closed on
Nov 17, 2006
Sold by
Gift Investments Llc
Bought by
Watson Morris Daniel
Current Estimated Value
Home Financials for this Owner
Home Financials are based on the most recent Mortgage that was taken out on this home.
Original Mortgage
$96,800
Outstanding Balance
$57,772
Interest Rate
6.37%
Mortgage Type
Purchase Money Mortgage
Estimated Equity
$257,026
Purchase Details
Closed on
Feb 23, 2006
Sold by
Rodriguez Philip G
Bought by
Gift Investments Llc
Purchase Details
Closed on
Nov 17, 2005
Sold by
Chamley Anna Marie and Rios Peter
Bought by
Rodriguez Philip G
Purchase Details
Closed on
Mar 10, 1995
Sold by
Chamley Thomas D
Bought by
Chamley Anna Marie
Home Financials for this Owner
Home Financials are based on the most recent Mortgage that was taken out on this home.
Original Mortgage
$38,297
Interest Rate
7.65%
Create a Home Valuation Report for This Property
The Home Valuation Report is an in-depth analysis detailing your home's value as well as a comparison with similar homes in the area
Home Values in the Area
Average Home Value in this Area
Purchase History
| Date | Buyer | Sale Price | Title Company |
|---|---|---|---|
| Watson Morris Daniel | -- | American Title | |
| Gift Investments Llc | -- | Lenders Title & Escrow | |
| Rodriguez Philip G | -- | First American Title Co | |
| Chamley Anna Marie | -- | -- |
Source: Public Records
Mortgage History
| Date | Status | Borrower | Loan Amount |
|---|---|---|---|
| Open | Watson Morris Daniel | $96,800 | |
| Previous Owner | Chamley Anna Marie | $38,297 |
Source: Public Records
Tax History Compared to Growth
Tax History
| Year | Tax Paid | Tax Assessment Tax Assessment Total Assessment is a certain percentage of the fair market value that is determined by local assessors to be the total taxable value of land and additions on the property. | Land | Improvement |
|---|---|---|---|---|
| 2025 | $2,483 | $151,612 | $65,000 | $86,612 |
| 2024 | $2,483 | $187,176 | $65,000 | $122,176 |
| 2023 | $2,271 | $196,454 | $45,000 | $151,454 |
| 2022 | $3,427 | $156,916 | $45,000 | $111,916 |
| 2021 | $3,851 | $163,484 | $45,000 | $118,484 |
| 2020 | $4,078 | $175,000 | $45,000 | $130,000 |
| 2019 | $3,788 | $175,000 | $45,000 | $130,000 |
| 2018 | $3,062 | $141,752 | $23,000 | $118,752 |
| 2017 | $3,117 | $141,958 | $23,000 | $118,958 |
| 2016 | $2,834 | $127,803 | $23,000 | $104,803 |
| 2015 | $2,399 | $106,500 | $18,000 | $88,500 |
| 2014 | $2,399 | $106,500 | $18,000 | $88,500 |
Source: Public Records
Map
Nearby Homes
- 1701 Winchester Way
- 933 Charleston Ct
- 952 Charleston Dr
- 1613 Trinity Ct
- 2025 Schumac Ln
- 2024 Charleston Dr
- 2201 Greendale Ct
- 2101 Gettysburg Place
- 1604 Richmond Dr
- 804 Natchez Ave
- 1213 Greendale Dr
- 1031 Boston Blvd
- 1049 Stableway Ln
- 1509 Shirley Way
- 1116 Highpoint Rd
- 828 Gregory Ave
- 904 Nelson Terrace
- 1004 Overhill Dr
- 2421 Creek Villas Dr
- 808 Gregory Ave
- 1909 Knoxville Dr
- 1901 Knoxville Dr
- 1904 Winchester Way
- 1900 Winchester Way
- 1913 Knoxville Dr
- 1908 Winchester Way
- 1904 Knoxville Dr
- 1908 Knoxville Dr
- 1900 Knoxville Dr
- 1912 Knoxville Dr
- 1917 Knoxville Dr
- 1821 Knoxville Dr
- 1912 Winchester Way
- 1816 Winchester Way
- 1916 Knoxville Dr
- 1817 Knoxville Dr
- 1901 Winchester Way
- 1905 Lexington Place
- 1909 Lexington Place
- 1921 Knoxville Dr