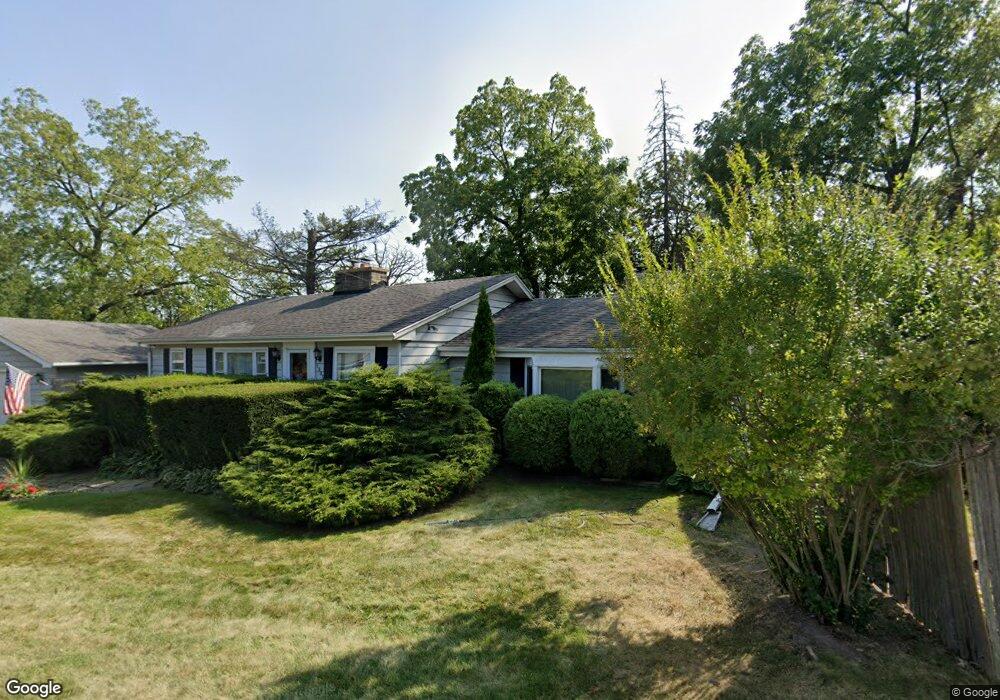
1905 N Bonnie Brook Ln Unit W Waukegan, IL 60087
Bonnie Brook NeighborhoodEstimated Value: $277,000 - $307,840
3
Beds
3
Baths
2,016
Sq Ft
$146/Sq Ft
Est. Value
About This Home
This home is located at 1905 N Bonnie Brook Ln Unit W, Waukegan, IL 60087 and is currently estimated at $293,710, approximately $145 per square foot. 1905 N Bonnie Brook Ln Unit W is a home located in Lake County with nearby schools including Little Fort Elementary School, Jack Benny Middle School, and Waukegan High School.
Create a Home Valuation Report for This Property
The Home Valuation Report is an in-depth analysis detailing your home's value as well as a comparison with similar homes in the area
Home Values in the Area
Average Home Value in this Area
Tax History Compared to Growth
Tax History
| Year | Tax Paid | Tax Assessment Tax Assessment Total Assessment is a certain percentage of the fair market value that is determined by local assessors to be the total taxable value of land and additions on the property. | Land | Improvement |
|---|---|---|---|---|
| 2024 | $6,161 | $81,321 | $13,465 | $67,856 |
| 2023 | $5,826 | $73,341 | $12,144 | $61,197 |
| 2022 | $5,826 | $65,595 | $11,515 | $54,080 |
| 2021 | $5,246 | $56,323 | $10,097 | $46,226 |
| 2020 | $5,268 | $52,472 | $9,407 | $43,065 |
| 2019 | $5,249 | $48,082 | $8,620 | $39,462 |
| 2018 | $5,715 | $50,585 | $11,816 | $38,769 |
| 2017 | $5,513 | $44,754 | $10,454 | $34,300 |
| 2016 | $4,391 | $34,415 | $8,039 | $26,376 |
| 2015 | $4,190 | $30,802 | $7,195 | $23,607 |
| 2014 | $4,981 | $35,422 | $8,554 | $26,868 |
| 2012 | $6,486 | $38,376 | $9,268 | $29,108 |
Source: Public Records
Map
Nearby Homes
- 1612 Whitney St
- 1636 Rice St
- 2613 N Lewis Ave
- 3211 Rugby Ct
- 2350 N Lewis Ave
- 37966 N Cornell Rd
- 3101 Country Club Ln
- 3411 N Lewis Ave
- 2708 Dana Ave
- 2705 Dana Ave
- 12312 W Audrey Ave
- 37905 N Loyola Ave
- 2713 Varonen Ave
- 38127 N Shore Ave
- 2232 Walnut St
- 38362 N Manor Ave
- 36955 N Garrick Ave
- 301 W Eagle Ct
- 1730 W Beach Rd
- 1913 Chippewa Rd
- 2842 N Lewis Ave
- 1910 N Bonnie Brook Ln Unit W
- 2836 N Lewis Ave
- 2912 N Lewis Ave
- 2912 E Bonnie Brook Ln
- 2830 N Lewis Ave
- 2005 N Bonnie Brook Ln Unit W
- 2842 E Bonnie Brook Ln
- 2918 N Lewis Ave
- 2845 N Lewis Ave
- 2836 E Bonnie Brook Ln
- 2821 N Lewis Ave
- 2010 N Bonnie Brook Ln Unit W
- 2849 N Lewis Ave
- 2835 N Lewis Ave
- 2830 E Bonnie Brook Ln
- 2817 N Lewis Ave
- 2817 E Bonnie Brook Ln
- 2901 N Lewis Ave
- 2924 N Lewis Ave