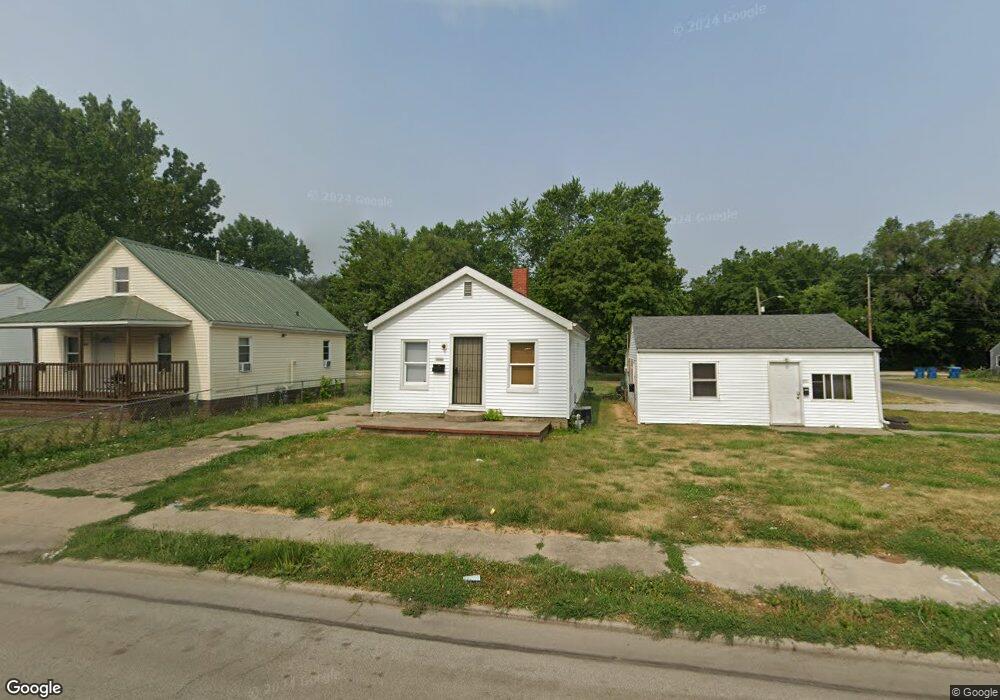
1905 S M l King Dr Unit M Springfield, IL 62703
Estimated Value: $45,675 - $72,000
--
Bed
--
Bath
--
Sq Ft
6,055
Sq Ft Lot
About This Home
This home is located at 1905 S M l King Dr Unit M, Springfield, IL 62703 and is currently estimated at $53,669. 1905 S M l King Dr Unit M is a home located in Sangamon County with nearby schools including Sandburg Elementary School, Benjamin Franklin Middle School, and Springfield Southeast High School.
Ownership History
Date
Name
Owned For
Owner Type
Purchase Details
Closed on
Oct 28, 2022
Sold by
Wells Aaron S
Bought by
Wells Tremonte
Current Estimated Value
Purchase Details
Closed on
Aug 4, 2022
Sold by
Tremonte Wells
Bought by
Wells Aaron S
Home Financials for this Owner
Home Financials are based on the most recent Mortgage that was taken out on this home.
Original Mortgage
$15,000
Interest Rate
5.81%
Mortgage Type
New Conventional
Purchase Details
Closed on
Jun 11, 2020
Sold by
Nicks Angela
Bought by
Wells Tremonte
Purchase Details
Closed on
Oct 4, 2019
Sold by
Donnie Feagans
Bought by
Nicks Angela
Purchase Details
Closed on
Feb 9, 2012
Purchase Details
Closed on
May 25, 2010
Purchase Details
Closed on
May 15, 2007
Purchase Details
Closed on
Aug 30, 2006
Purchase Details
Closed on
Jul 8, 2005
Purchase Details
Closed on
Dec 31, 1998
Purchase Details
Closed on
Feb 4, 1997
Purchase Details
Closed on
Sep 15, 1988
Create a Home Valuation Report for This Property
The Home Valuation Report is an in-depth analysis detailing your home's value as well as a comparison with similar homes in the area
Home Values in the Area
Average Home Value in this Area
Purchase History
| Date | Buyer | Sale Price | Title Company |
|---|---|---|---|
| Wells Tremonte | -- | -- | |
| Wells Aaron S | $20,000 | Barber Segatto Hoffee Wilke & | |
| Wells Tremonte | $12,000 | Nicks Angela | |
| Nicks Angela | $600 | -- | |
| -- | -- | -- | |
| -- | $25,500 | -- | |
| -- | -- | -- | |
| -- | -- | -- | |
| -- | $10,000 | -- | |
| -- | $11,000 | -- | |
| -- | $16,500 | -- | |
| -- | $13,500 | -- |
Source: Public Records
Mortgage History
| Date | Status | Borrower | Loan Amount |
|---|---|---|---|
| Previous Owner | Wells Aaron S | $15,000 |
Source: Public Records
Tax History Compared to Growth
Tax History
| Year | Tax Paid | Tax Assessment Tax Assessment Total Assessment is a certain percentage of the fair market value that is determined by local assessors to be the total taxable value of land and additions on the property. | Land | Improvement |
|---|---|---|---|---|
| 2024 | $414 | $4,923 | $1,489 | $3,434 |
| 2023 | $398 | $4,497 | $1,360 | $3,137 |
| 2022 | $382 | $4,266 | $1,290 | $2,976 |
| 2021 | $370 | $4,107 | $1,242 | $2,865 |
| 2020 | $362 | $4,113 | $1,244 | $2,869 |
| 2019 | $356 | $4,099 | $1,240 | $2,859 |
| 2018 | $256 | $3,033 | $1,234 | $1,799 |
| 2017 | $251 | $2,994 | $1,218 | $1,776 |
| 2016 | $246 | $2,950 | $1,200 | $1,750 |
| 2015 | $244 | $2,915 | $1,186 | $1,729 |
| 2014 | $262 | $2,896 | $1,178 | $1,718 |
| 2013 | $257 | $3,166 | $1,178 | $1,988 |
Source: Public Records
Map
Nearby Homes
- 1842 S Martin Luther King jr Dr
- 1903 S 16th St
- 2114 S Renfro St
- 1920 S 19th St
- 1604 S 15th St
- 2041 Gregory Ct
- 2120 S 13th St
- 2023 E Spruce St
- 2041 E Cedar St
- 2154 S 13th St
- 1833 S Street Ct
- 2228 S 14th St
- 1322 S Grand Ave E
- 2216 S 13th St
- 1813 Greentree Rd
- 2313 S 13th St
- 1118 S Martin Luther King Junior Dr
- 2842 S Grand Ave E
- 2800 S Grand Ave E
- 2821 S Grand Ave E
- 1907 S M l King Dr Unit M
- 1901 S M l King Dr Unit M
- 1913 S M l King Dr Unit M
- 1917 S M l King Dr Unit M
- 1913 S Martin Luther King Junior Dr
- 1906 S M l King Dr Unit M
- 1908 S M l King Dr Unit M
- 1902 S Martin Luther King jr Dr
- 1916 S M l King Dr Unit M
- 1922 S M l King Dr Unit M
- 1859 S Martin Luther King jr Dr Unit M
- 1924 S M l King Dr Unit M
- 1862 S Martin Luther King jr Dr Unit M
- 1855 S Martin Luther King Junior Dr
- 1855 S Martin Luther King jr Dr Unit M
- 1855 S Martin Luther King jr Dr
- 1720 South St
- 1921 S Martin Luther King jr Dr Unit M
- 1716 South St
- 1710 E South St