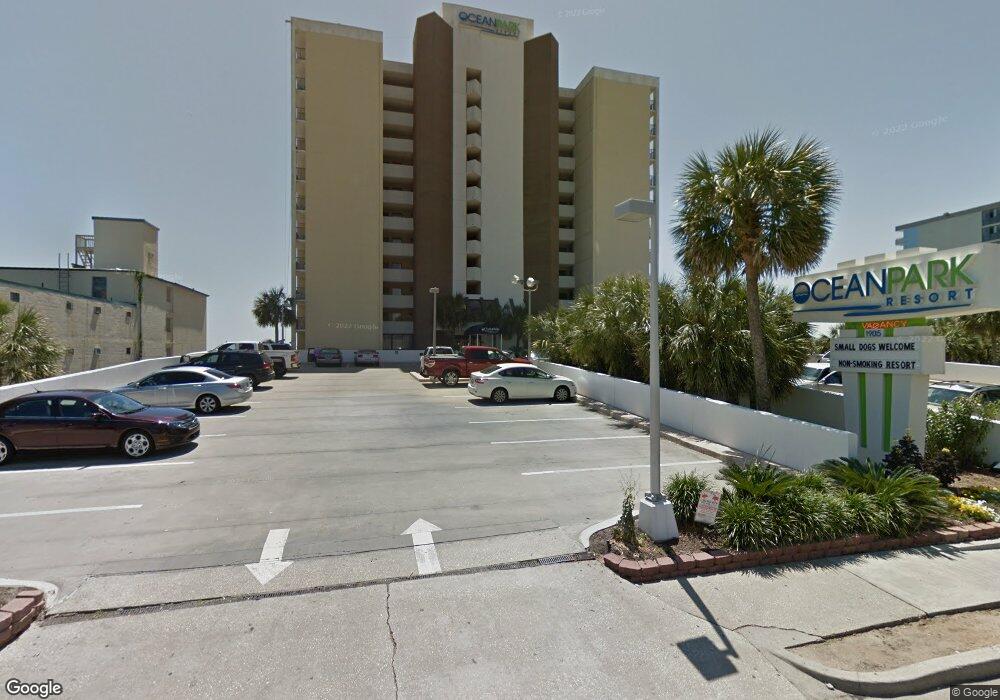
1905 S Ocean Blvd Myrtle Beach, SC 29577
Estimated Value: $244,230 - $281,000
2
Beds
2
Baths
1,010
Sq Ft
$261/Sq Ft
Est. Value
About This Home
This home is located at 1905 S Ocean Blvd, Myrtle Beach, SC 29577 and is currently estimated at $263,558, approximately $260 per square foot. 1905 S Ocean Blvd is a home located in Horry County with nearby schools including Myrtle Beach Child Development Center, Myrtle Beach Primary School, and Myrtle Beach Elementary School.
Ownership History
Date
Name
Owned For
Owner Type
Purchase Details
Closed on
Dec 2, 2020
Sold by
Recon Properties Llc
Bought by
Cumberland John M and Cumberland Sara Jeu
Current Estimated Value
Purchase Details
Closed on
Mar 6, 2019
Sold by
Darden Anthony L
Bought by
Ocean Park Owners Association Inc
Purchase Details
Closed on
Jan 18, 2017
Sold by
Foster Jack
Bought by
Darden Anthony L
Purchase Details
Closed on
Sep 21, 2010
Sold by
Bank Of America Trustee
Bought by
Foster Jack
Purchase Details
Closed on
Jul 20, 2010
Sold by
Master In Equity Horry County
Bought by
Bank Of America National Association
Purchase Details
Closed on
May 24, 2006
Sold by
Sherman Eugene V and Sherman Shirley A
Bought by
Gehsmann Kurt
Home Financials for this Owner
Home Financials are based on the most recent Mortgage that was taken out on this home.
Original Mortgage
$234,000
Interest Rate
6.5%
Mortgage Type
Fannie Mae Freddie Mac
Create a Home Valuation Report for This Property
The Home Valuation Report is an in-depth analysis detailing your home's value as well as a comparison with similar homes in the area
Home Values in the Area
Average Home Value in this Area
Purchase History
| Date | Buyer | Sale Price | Title Company |
|---|---|---|---|
| Cumberland John M | $119,900 | -- | |
| Ocean Park Owners Association Inc | -- | -- | |
| Darden Anthony L | $120,000 | None Available | |
| Foster Jack | $88,000 | -- | |
| Bank Of America National Association | $98,000 | -- | |
| Gehsmann Kurt | $292,500 | None Available |
Source: Public Records
Mortgage History
| Date | Status | Borrower | Loan Amount |
|---|---|---|---|
| Previous Owner | Gehsmann Kurt | $234,000 |
Source: Public Records
Tax History Compared to Growth
Tax History
| Year | Tax Paid | Tax Assessment Tax Assessment Total Assessment is a certain percentage of the fair market value that is determined by local assessors to be the total taxable value of land and additions on the property. | Land | Improvement |
|---|---|---|---|---|
| 2024 | $2,197 | $18,000 | $0 | $18,000 |
| 2023 | $2,197 | $13,125 | $0 | $13,125 |
| 2021 | $2,027 | $13,125 | $0 | $13,125 |
| 2020 | $1,897 | $12,884 | $0 | $12,884 |
| 2019 | $1,809 | $12,285 | $0 | $12,285 |
| 2018 | $1,915 | $12,600 | $0 | $12,600 |
| 2017 | $1,578 | $6,000 | $0 | $6,000 |
| 2016 | -- | $6,000 | $0 | $6,000 |
| 2015 | $1,560 | $10,500 | $0 | $10,500 |
| 2014 | $1,517 | $6,000 | $0 | $6,000 |
Source: Public Records
Map
Nearby Homes
- 1905 S Ocean Blvd Unit 922-924
- 1906 S Ocean Blvd Unit 310B
- 1906 S Ocean Blvd Unit V409A
- 2001 S Ocean Blvd Unit 720
- 2001 S Ocean Blvd Unit 612
- 2001 S Ocean Blvd Unit 919
- 2001 S Ocean Blvd Unit 716
- 2001 S Ocean Blvd Unit 816
- 2001 S Ocean Blvd Unit 209
- 2001 S Ocean Blvd Unit 417
- 2001 S Ocean Blvd Unit 1010
- 2001 S Ocean Blvd Unit 1108
- 2001 S Ocean Blvd Unit 701
- 2001 S Ocean Blvd Unit 820
- 2001 S Ocean Blvd Unit 813
- 2001 S Ocean Blvd Unit 715
- 2001 S Ocean Blvd Unit 1310
- 2001 S Ocean Blvd Unit 206
- 2001 S Ocean Blvd Unit 1203
- 2001 S Ocean Blvd Unit 1210
- 1905 S Ocean Blvd 304-Ocean Park
- 1905 S Ocean Blvd 404-Ocean Park
- 1905 S Ocean Blvd Unit Ocean Park 922/924
- 1905 S Ocean Blvd Unit 504 Ocean Park
- 1905 S Ocean Blvd Unit 1208 Ocean Park
- 1905 S Ocean Blvd Unit 322-324 Ocean Park
- 1905 S Ocean Blvd Unit 422/424 Ocean Park
- 1905 S Ocean Blvd Unit 722/724
- 1905 S Ocean Blvd Unit Ocean Park
- 1905 S Ocean Blvd Unit 1212 OCEAN PARK
- 1905 S Ocean Blvd Unit 1222-1224,1220
- 1905 S Ocean Blvd Unit 522-524
- 1905 S Ocean Blvd Unit 1216
- 1905 S Ocean Blvd Unit 1022-1024
- 1905 S Ocean Blvd Unit 204 Ocean Park
- 1905 S Ocean Blvd Unit 1208
- 1905 S Ocean Blvd Unit 1204-1202
- 1905 S Ocean Blvd Unit Ocean Park, Unit 120
- 1905 S Ocean Blvd Unit 1212
- 1905 S Ocean Blvd Unit 604