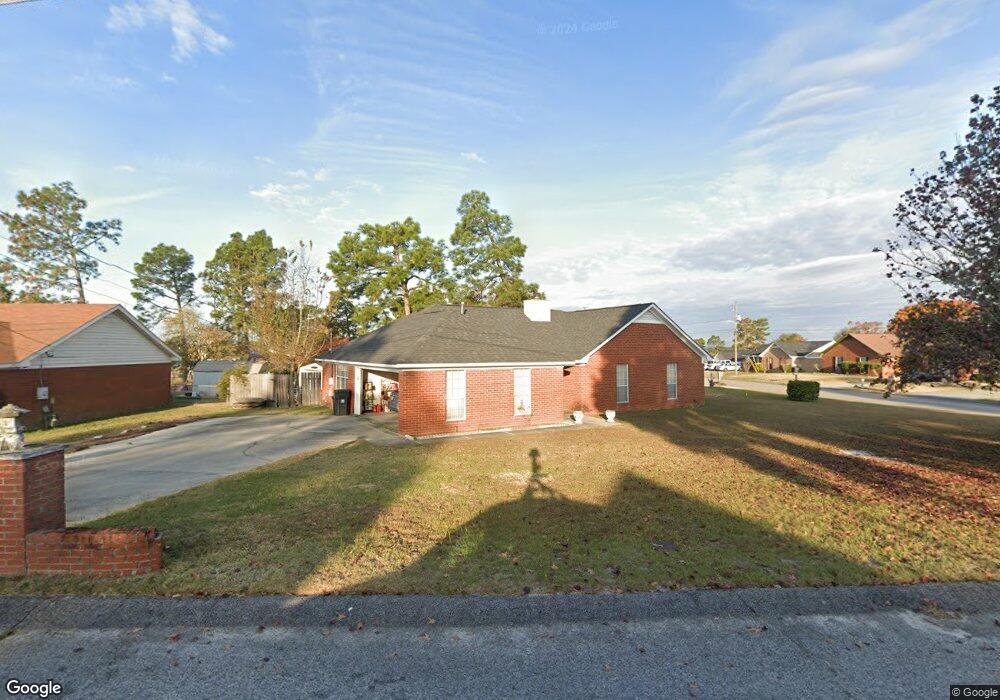
1905 Sagemont Dr Augusta, GA 30906
Pepperidge NeighborhoodEstimated Value: $209,686 - $223,000
3
Beds
2
Baths
1,858
Sq Ft
$115/Sq Ft
Est. Value
About This Home
This home is located at 1905 Sagemont Dr, Augusta, GA 30906 and is currently estimated at $213,422, approximately $114 per square foot. 1905 Sagemont Dr is a home located in Richmond County with nearby schools including Tobacco Road Elementary School, Richmond Hill K-8, and Johnson Magnet.
Ownership History
Date
Name
Owned For
Owner Type
Purchase Details
Closed on
Apr 11, 1997
Sold by
Saulsby Pyong Sim
Bought by
Saulsby Orrin W
Current Estimated Value
Purchase Details
Closed on
Dec 27, 1996
Sold by
Saulsby Pyong Sim
Bought by
Saulsby Orrin W
Purchase Details
Closed on
Mar 7, 1991
Sold by
Saulsby Orrin W
Bought by
Saulsby Pyong Sim
Purchase Details
Closed on
Feb 25, 1991
Sold by
Nordahl Homes Inc
Bought by
Saulsby Orrin W
Purchase Details
Closed on
Feb 22, 1991
Sold by
Saulsby Orrin W
Bought by
Saulsby Pyong Sim
Purchase Details
Closed on
Jan 23, 1991
Sold by
Nordahl & Company Inc
Bought by
Nordahl Homes Inc
Purchase Details
Closed on
Jan 9, 1991
Purchase Details
Closed on
Jun 14, 1990
Sold by
Griffis Albert
Bought by
Nordahl & Company Inc
Purchase Details
Closed on
May 30, 1990
Sold by
Griffis Albert
Bought by
Nordahl & Company I
Create a Home Valuation Report for This Property
The Home Valuation Report is an in-depth analysis detailing your home's value as well as a comparison with similar homes in the area
Home Values in the Area
Average Home Value in this Area
Purchase History
| Date | Buyer | Sale Price | Title Company |
|---|---|---|---|
| Saulsby Orrin W | -- | -- | |
| Saulsby Orrin W | -- | -- | |
| Saulsby Pyong Sim | -- | -- | |
| Saulsby Orrin W | -- | -- | |
| Saulsby Pyong Sim | -- | -- | |
| Saulsby Orrin W | $87,200 | -- | |
| Nordahl Homes Inc | -- | -- | |
| -- | -- | -- | |
| Nordahl & Company Inc | $175,000 | -- | |
| Nordahl & Company I | $175,000 | -- |
Source: Public Records
Tax History
| Year | Tax Paid | Tax Assessment Tax Assessment Total Assessment is a certain percentage of the fair market value that is determined by local assessors to be the total taxable value of land and additions on the property. | Land | Improvement |
|---|---|---|---|---|
| 2025 | $2,390 | $76,460 | $7,380 | $69,080 |
| 2024 | $2,390 | $76,492 | $7,380 | $69,112 |
| 2023 | $2,315 | $79,936 | $7,380 | $72,556 |
| 2022 | $2,219 | $70,099 | $7,380 | $62,719 |
| 2021 | $1,548 | $42,483 | $7,380 | $35,103 |
| 2020 | $1,526 | $42,483 | $7,380 | $35,103 |
| 2019 | $1,608 | $42,483 | $7,380 | $35,103 |
| 2018 | $1,618 | $42,483 | $7,380 | $35,103 |
| 2017 | $1,574 | $42,483 | $7,380 | $35,103 |
| 2016 | $1,575 | $42,483 | $7,380 | $35,103 |
| 2015 | $1,585 | $42,483 | $7,380 | $35,103 |
| 2014 | $1,587 | $42,483 | $7,380 | $35,103 |
Source: Public Records
Map
Nearby Homes
- 2120 Faircrest Ave
- 3545 Monte Carlo Dr
- 4349 White Pines Ct
- 2104 Oakleaf Way
- 4365 White Pine Ct
- 3622 Seelye Dr
- 3388 Thames Place
- 3758 Bansbury Place
- 3434 Thames Place
- 3436 Thames Place
- 3346 Thames Place
- 2113 Chadwick Rd
- 3606 Greiner Dr
- 3611 Kentwood Dr Unit 1
- 2115 Ashley Dr
- 4104 Short Leaf Ct
- 3708 Lexington Dr
- 2101 Rosier Rd
- 3640 Elliott Blvd
- 3414 Essex Place
- 1907 Sagemont Dr
- 2204 Sagemont Ct
- 1910 Sagemont Dr
- 2206 Sagemont Ct
- 2201 Sagemont Ct
- 1908 Sagemont Dr
- 1909 Sagemont Dr
- 1912 Sagemont Dr
- 2157 Faircrest Ave
- 2203 Sagemont Ct
- 1906 Sagemont Dr
- 2159 Faircrest Ave
- 2205 Sagemont Ct
- 2153 Faircrest Ave
- 1904 Sagemont Dr
- 2208 Sagemont Ct
- 2161 Faircrest Ave
- 1901 Sagemont Dr
- 2207 Sagemont Ct
- 3424 Linderwood Dr
Your Personal Tour Guide
Ask me questions while you tour the home.