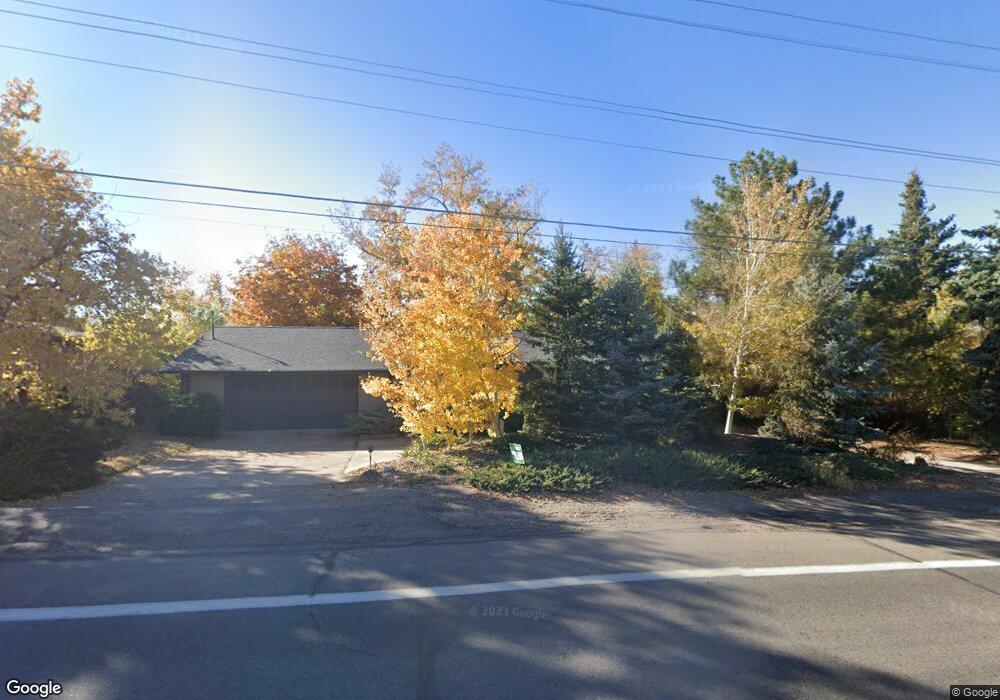
1905 Simms St Lakewood, CO 80215
Applewood Valley NeighborhoodEstimated Value: $840,405 - $1,161,000
4
Beds
3
Baths
3,078
Sq Ft
$313/Sq Ft
Est. Value
About This Home
This home is located at 1905 Simms St, Lakewood, CO 80215 and is currently estimated at $963,101, approximately $312 per square foot. 1905 Simms St is a home located in Jefferson County with nearby schools including Stober Elementary School, Everitt Middle School, and Wheat Ridge High School.
Ownership History
Date
Name
Owned For
Owner Type
Purchase Details
Closed on
Mar 10, 2017
Sold by
Andrus Amanda K
Bought by
Amanda K Andrus Trust
Current Estimated Value
Purchase Details
Closed on
May 28, 2010
Sold by
Ebbesen Lars O and Phillips Lisa E
Bought by
Sondrup Scott R and Andrus Amanda K
Home Financials for this Owner
Home Financials are based on the most recent Mortgage that was taken out on this home.
Original Mortgage
$342,537
Outstanding Balance
$228,440
Interest Rate
4.87%
Mortgage Type
FHA
Estimated Equity
$734,661
Purchase Details
Closed on
Nov 10, 2009
Sold by
Ebbesen Lars O
Bought by
Phillips Lisa E
Purchase Details
Closed on
Mar 16, 1999
Sold by
Ebbesen Ole V Testamentary Family Tr and Ebbesen Karen K
Bought by
Ebbesen Karen K
Purchase Details
Closed on
May 19, 1998
Sold by
Ebbesen Ole V and Ebbesen Karen K
Bought by
Ole Vagn Ebbesen Testamentary Family Tr and Ebbesen Ole Vagn
Create a Home Valuation Report for This Property
The Home Valuation Report is an in-depth analysis detailing your home's value as well as a comparison with similar homes in the area
Home Values in the Area
Average Home Value in this Area
Purchase History
| Date | Buyer | Sale Price | Title Company |
|---|---|---|---|
| Amanda K Andrus Trust | -- | None Available | |
| Scott R Sondrup Trust | -- | None Available | |
| Sondrup Scott R | -- | None Available | |
| Sondrup Scott R | $360,000 | Land Title Guarantee Company | |
| Phillips Lisa E | -- | None Available | |
| Ebbesen Karen K | $106,960 | -- | |
| Ole Vagn Ebbesen Testamentary Family Tr | -- | -- |
Source: Public Records
Mortgage History
| Date | Status | Borrower | Loan Amount |
|---|---|---|---|
| Open | Sondrup Scott R | $342,537 |
Source: Public Records
Tax History Compared to Growth
Tax History
| Year | Tax Paid | Tax Assessment Tax Assessment Total Assessment is a certain percentage of the fair market value that is determined by local assessors to be the total taxable value of land and additions on the property. | Land | Improvement |
|---|---|---|---|---|
| 2024 | $4,147 | $43,260 | $20,560 | $22,700 |
| 2023 | $4,147 | $43,260 | $20,560 | $22,700 |
| 2022 | $3,735 | $37,892 | $13,573 | $24,319 |
| 2021 | $3,766 | $38,983 | $13,964 | $25,019 |
| 2020 | $3,447 | $35,678 | $12,025 | $23,653 |
| 2019 | $3,403 | $35,678 | $12,025 | $23,653 |
| 2018 | $3,237 | $33,079 | $9,662 | $23,417 |
| 2017 | $2,913 | $33,079 | $9,662 | $23,417 |
| 2016 | $2,946 | $31,483 | $10,485 | $20,998 |
| 2015 | $2,444 | $31,483 | $10,485 | $20,998 |
| 2014 | $2,444 | $23,795 | $9,308 | $14,487 |
Source: Public Records
Map
Nearby Homes
- 1825 Simms St
- 1832 Simms St Unit 1832A
- 1830 Simms St
- 11715 W 18th Ave
- 1802 Simms St
- 11423 W 17th Place Unit I11423
- 11422 W 17th Place
- 1723 Robb St Unit 45
- 1723 Robb St Unit 26
- 11813 W 17th Ave
- 1678 Tabor St
- 11217 W 18th Ave Unit A
- 2110 Tabor Dr
- 2055 Quail Dr
- 2140 Tabor Dr
- 1540 Simms St
- 12075 W 18th Dr
- 1555 Swadley St
- 11940 W Independence Ave
- 11133 W 17th Ave Unit 105
- 1975 Simms St
- 1845 Simms St
- 1900 Tabor St
- 1985 Simms St
- 1930 Tabor St
- 1880 Tabor St
- 1940 Simms St
- 1950 Simms St
- 1995 Simms St
- 1920 Simms St
- 1800 Swadley St
- 1815 Simms St
- 11660 W 20th Ave
- 1960 Tabor St
- 11650 W 20th Ave
- 1935 Tabor St
- 1895 Tabor St
- 1808 Simms St
- 1808 Simms St
- 1808 Simms St Unit Simms Bedroom 4